GBP/USD Price Analysis: Retreats from 21-HMA inside weekly falling wedge
- GBP/USD struggles to defend the bounce off monthly low inside bullish chart formation.
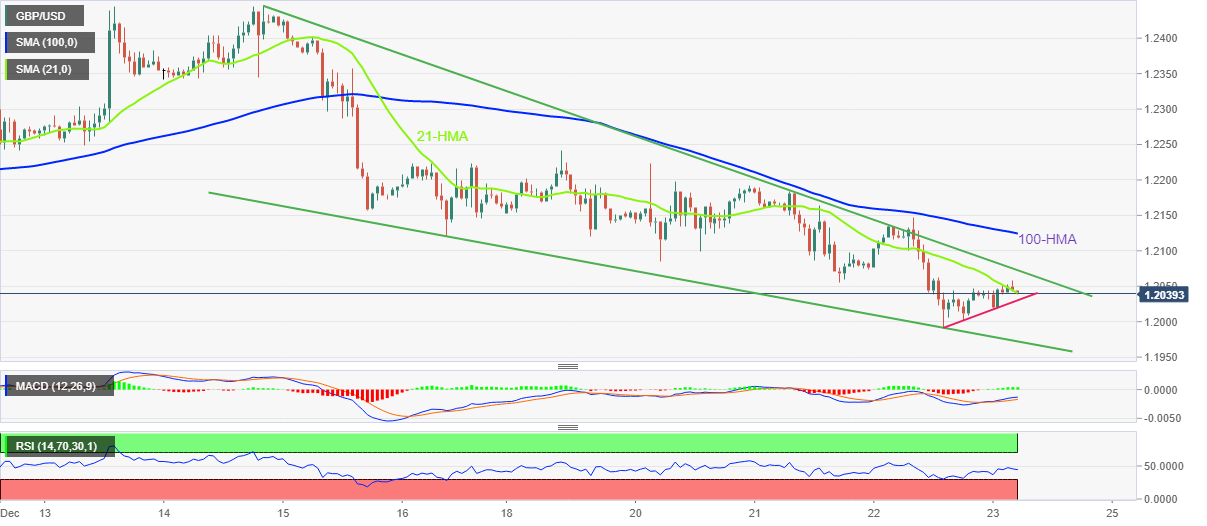
- Bullish MACD signals, immediate support line keep buyers hopeful.
- 100-HMA adds to the upside filters before giving control to bulls.
GBP/USD steps back from intraday high of 1.2058 heading into Friday’s London open. In doing so, the Cable pair fails to defend the first daily gains in three inside a one-week-old bullish chart formation, namely falling wedge.
That said, the quote’s pullback could also be linked to a retreat from the 21-HMA, around 1.2045 by the press time. It’s worth noting that the weakness in prices also takes clues from the RSI’s lower-high formation.
However, the bullish MACD signals and an ascending support line from Thursday, near 1.2030, restrict the GBP/USD pair’s immediate downside.
Also acting as the short-term key support is the 1.2000 psychological magnet and the stated wedge’s lower line, close to 1.1970.
In a case where GBP/USD remains bearish past 1.1970, July’s low near 1.1760 will gain the market’s attention.
On the contrary, an upside break of the wedge’s top line, at 1.2075 by the press time, could confirm the bullish chart formation that marks a theoretical target of 1.2530.
Though, the 100-HMA level of 1.2125 and the monthly high near 1.2446 could act as buffers during the quote’s run-up beyond 1.2075.
GBP/USD: Hourly chart
Trend: Limited recovery expected