Back
19 Nov 2018
Gold Technical Analysis: Potential pullback to $1,217.70 a troy ounce
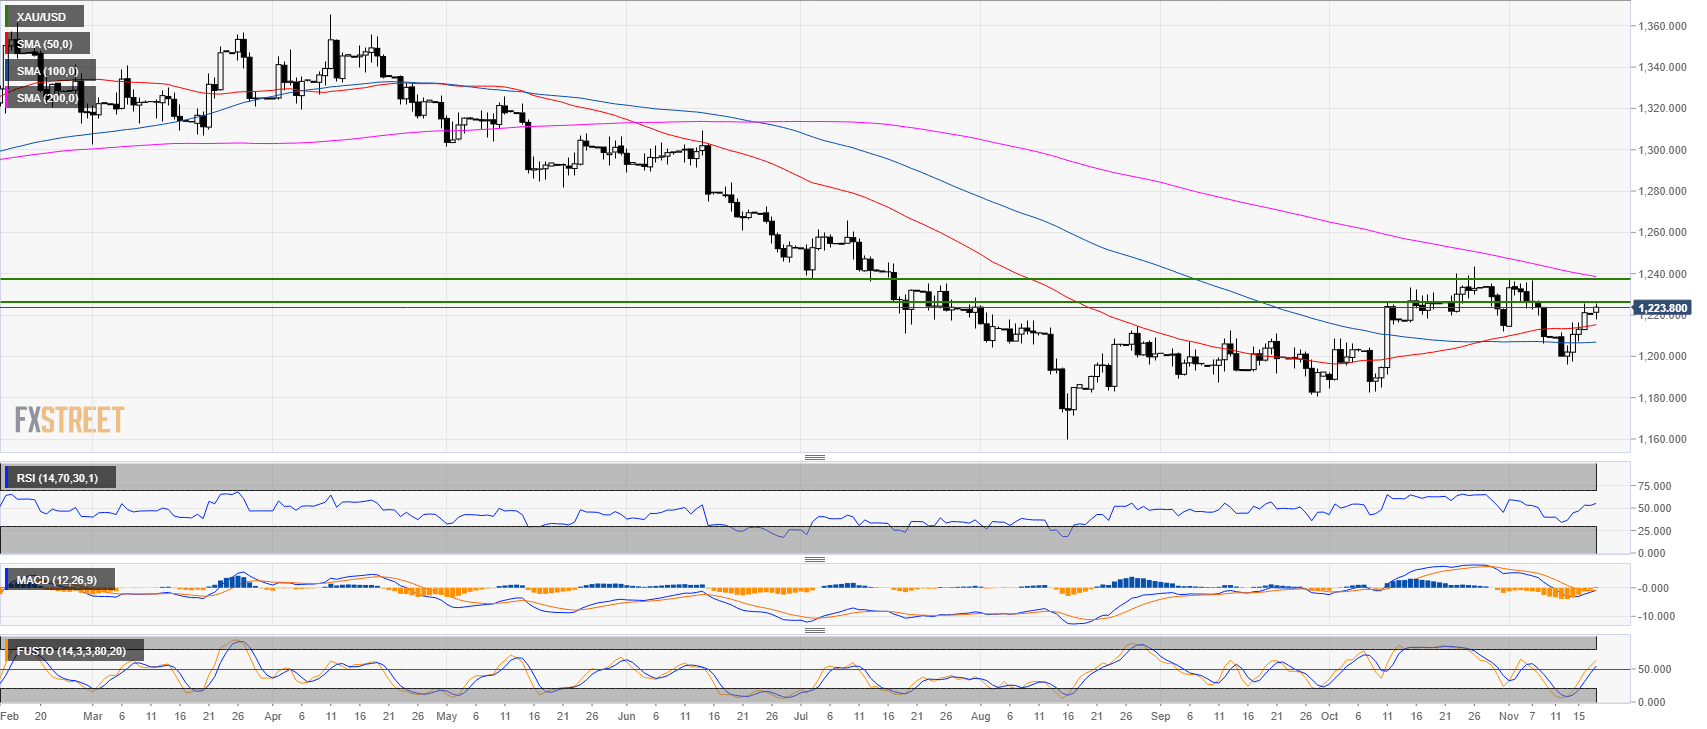
Daily chart
- Gold is trading in a bear trend below the 200-period simple moving average (SMA).
- However, bulls managed to claim the 50 and 100 SMA with the 50 SMA crossing above the 100 SMA.
- The RSI and Stochastic indicators are trading above the 50 line suggesting bullishness in the market. The MACD is also turning bullish.

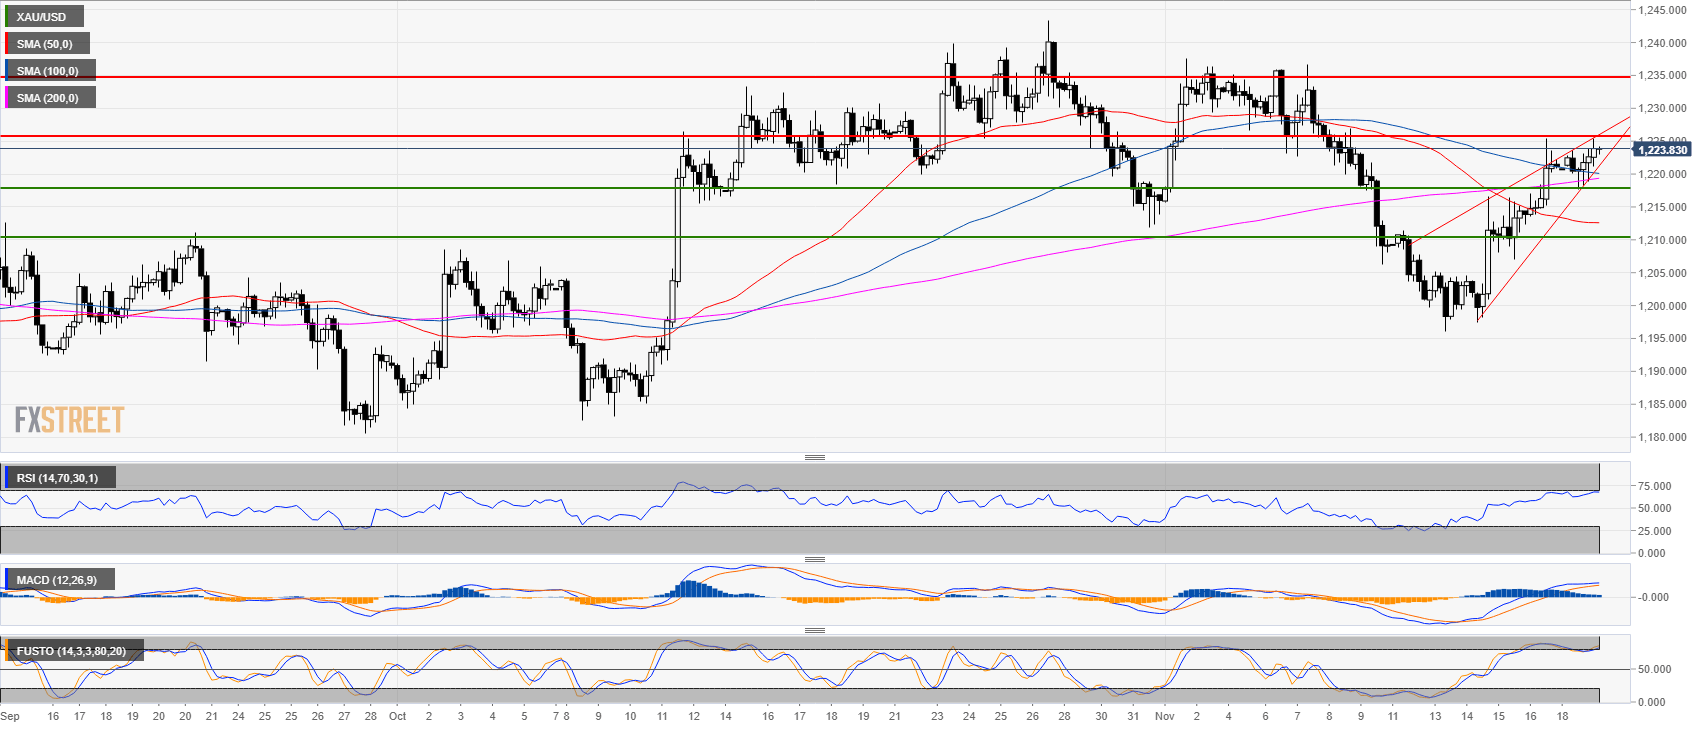
4-hour chart
- 1,225.40, the current high of the day seems to cap any further advances.
- Gold formed a wedge-shaped pattern with potential bearish implications.
- A pullback to 1,217.70 seems to be in the cards

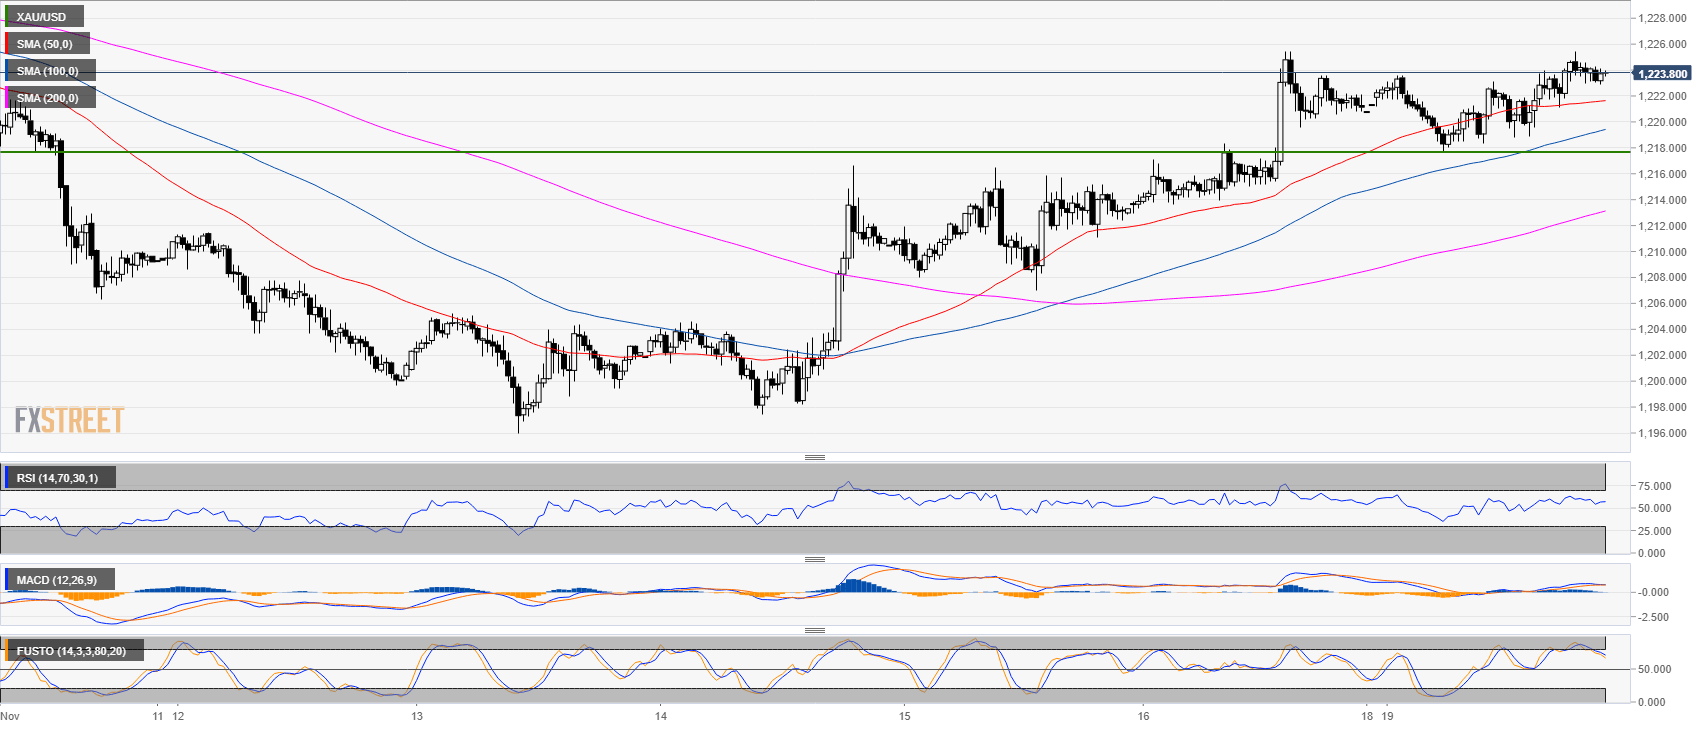
30-minute chart
- The RSI indicator is still above 50 while the Stochastic is leaving the overbought zone.
- The MACD is turning bearish. All suggesting that Gold might have a pullback to 1,217.70 soon.

Additional key levels at a glance:
XAU/USD
Overview:
Last Price: 1223.76
Daily change: 3.0e+2 pips
Daily change: 0.242%
Daily Open: 1220.8
Trends:
Daily SMA20: 1220.15
Daily SMA50: 1214.77
Daily SMA100: 1206.74
Daily SMA200: 1239.09
Levels:
Daily High: 1220.8
Daily Low: 1220.8
Weekly High: 1225.4
Weekly Low: 1196
Monthly High: 1243.43
Monthly Low: 1182.54
Daily Fibonacci 38.2%: 1220.8
Daily Fibonacci 61.8%: 1220.8
Daily Pivot Point S1: 1220.8
Daily Pivot Point S2: 1220.8
Daily Pivot Point S3: 1220.8
Daily Pivot Point R1: 1220.8
Daily Pivot Point R2: 1220.8
Daily Pivot Point R3: 1220.8
