EUR/USD Technical Analysis: FOMC knee-jerk reaction down - Euro bulls waiting around the corner
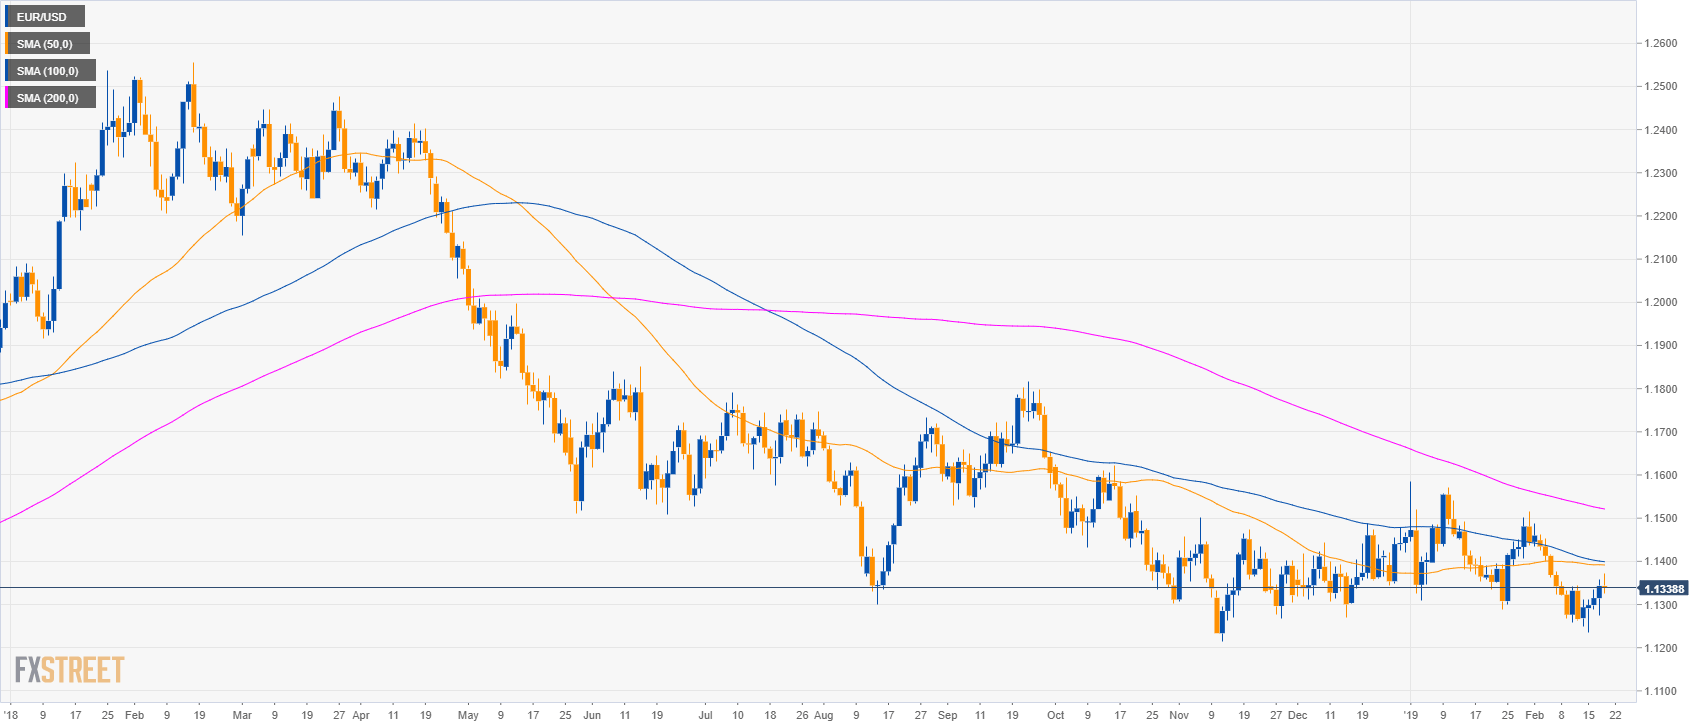
EUR/USD daily chart
- EUR/USD is evolving in a bear trend below the 200-day simple moving average (SMA).
- EUR/USD dropped about 30 pips after the release of the FOMC Minutes which were less dovish than expected.
- However, this is most likely to be seen as a small pullback down as Euro bulls should be back rather soon.
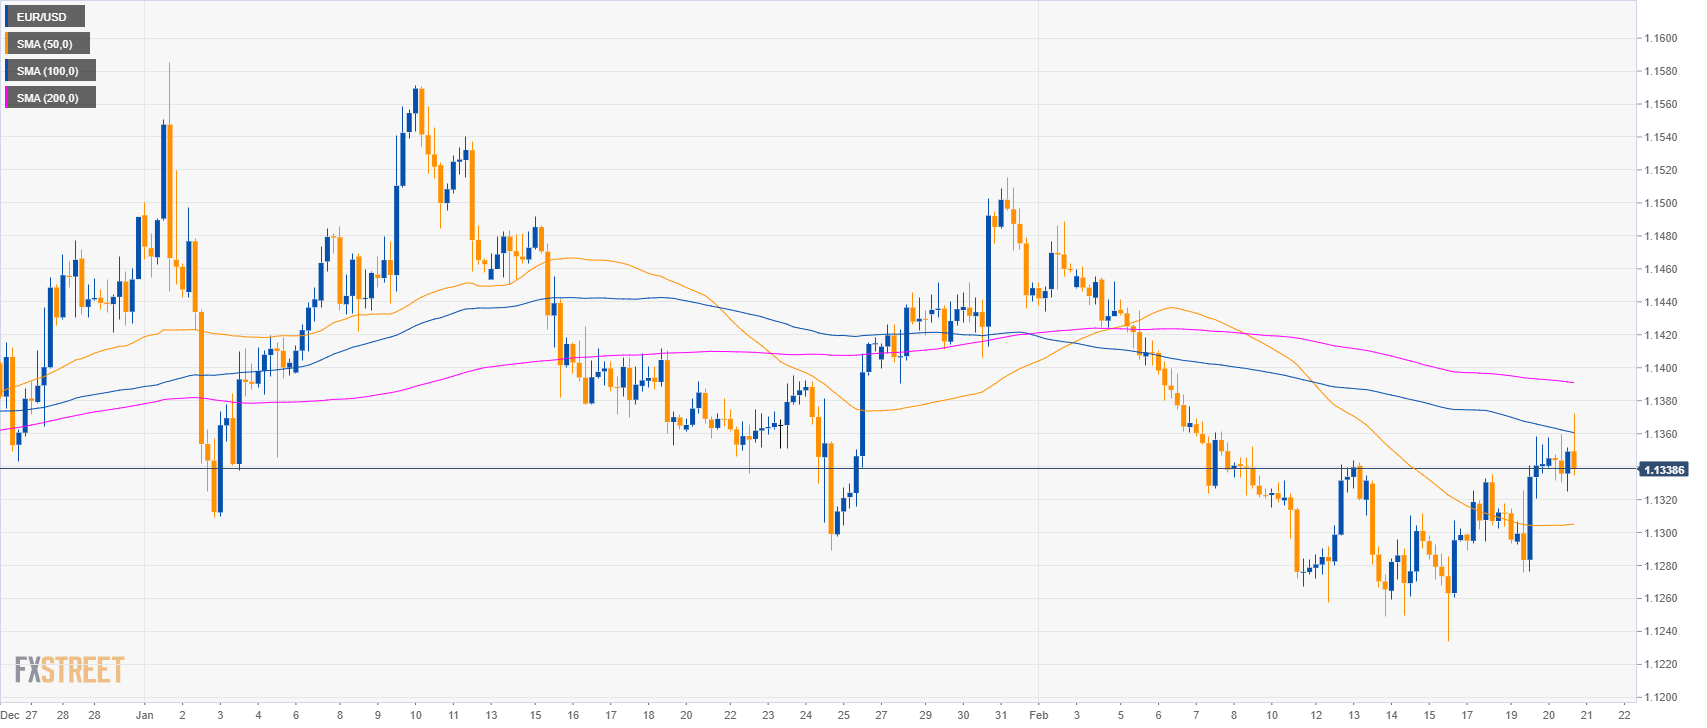
EUR/USD 4-hour chart
- EUR/USD is currently rejecting the 100 SMA.
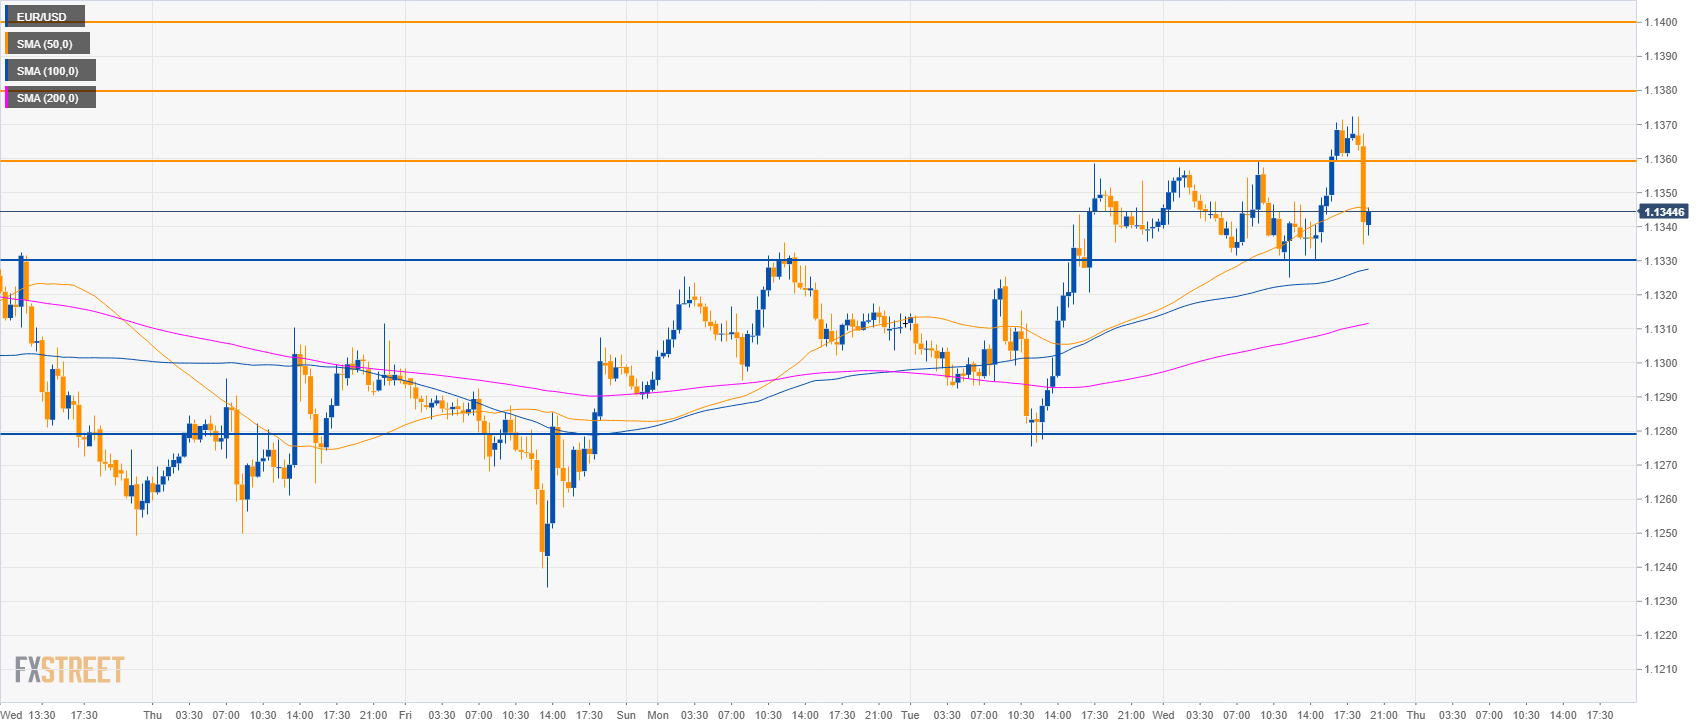
EUR/USD 30-minute chart
- EUR/USD is trading above the 200 SMA but bears are trying to brake below the 50 SMA suggesting a pullback.
- Bulls are still in contriol and a break above 1.1360 should lead to 1.1380 and 1.1400 figure.
- To the downside, support is at 1.1330 and 1.1280 key level.
Additional key levels
EUR/USD
Overview:
Today Last Price: 1.1341
Today Daily change: -2 pips
Today Daily change %: -0.02%
Today Daily Open: 1.1343
Trends:
Daily SMA20: 1.1368
Daily SMA50: 1.1392
Daily SMA100: 1.14
Daily SMA200: 1.1524
Levels:
Previous Daily High: 1.1358
Previous Daily Low: 1.1276
Previous Weekly High: 1.1344
Previous Weekly Low: 1.1234
Previous Monthly High: 1.1586
Previous Monthly Low: 1.1289
Daily Fibonacci 38.2%: 1.1327
Daily Fibonacci 61.8%: 1.1307
Daily Pivot Point S1: 1.1293
Daily Pivot Point S2: 1.1243
Daily Pivot Point S3: 1.121
Daily Pivot Point R1: 1.1376
Daily Pivot Point R2: 1.1409
Daily Pivot Point R3: 1.1459