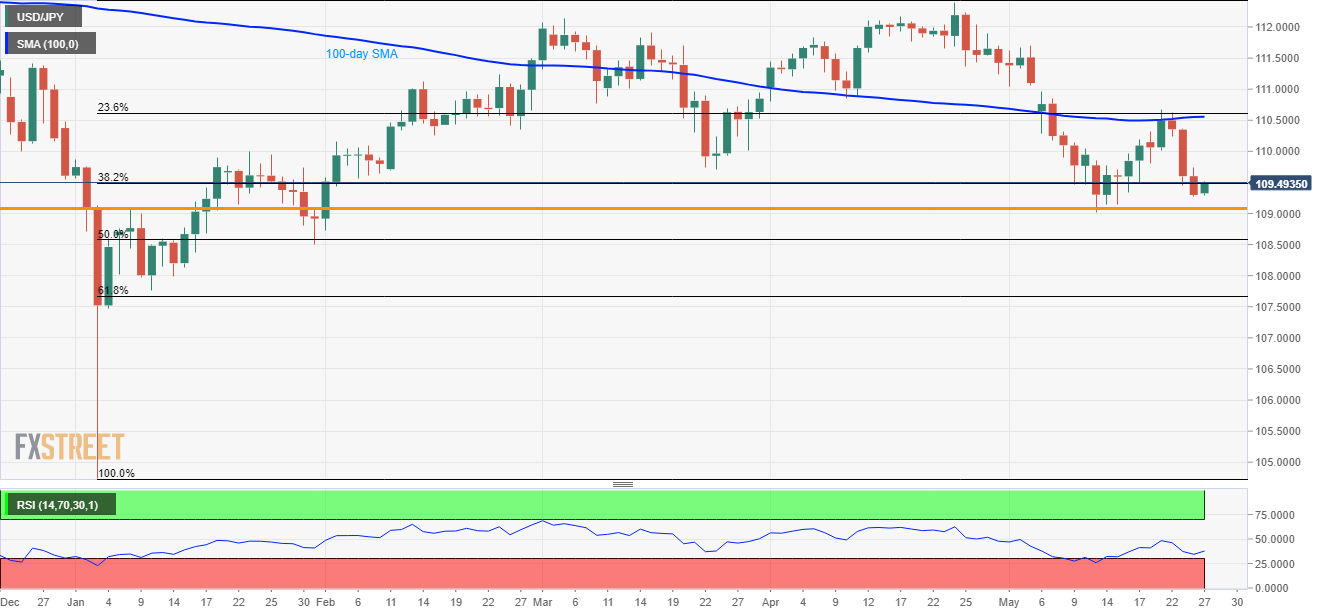
USD/JPY technical analysis: 109.20/15 remains on seller’s radar unless 110.55/60 breaks
- Sustained trading under important resistance portrays pair’s weakness.
- Sellers can target near-term horizontal support during downside.
The USD/JPY pair is on the bids near 109.50 ahead of Europe open on Monday.
The 110.55/60 resistance-confluence including 100-day simple moving average (SMA) and 23.6% Fibonacci retracement of January to April rise acts as strong upside cap. Though, 109.80 and 110.30 could entertain buyers during intermediate increase.
Should prices rally past-110.60, 111.00, 111.80 and April month top near 112.40 could be on the bulls’ radar.
Alternatively, multiple lows have been limiting the pair’s downside around 109.20/15 since the year’s start, which if ignored could rely on oversold levels of 14-day relative strength index (RSI) to visit 50% Fibonacci retracement near 108.60.
Given the pair’s extended south-run under 108.60, 108.00 and 107.50 becomes important to watch.
USD/JPY daily chart

Trend: Pullback expected
