USD/IDR technical analysis: Inaction between 21-D EMA, 20-week old support-line continues
- Failure to cross the key support/resistance holds the USD/IDR pair tightly around 23.6% Fibonacci retracement.
- RSI also remains in the normal region.
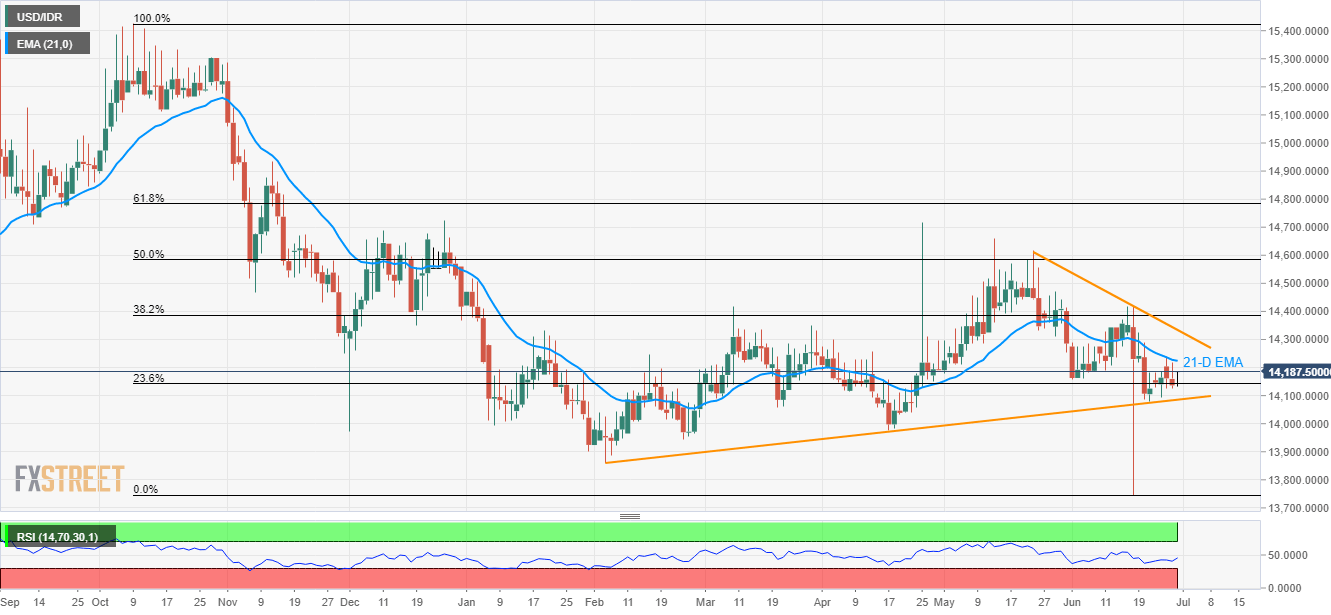
Not only 21-day exponential moving average (21-D EMA) but an upward sloping trend-line since early February also limits the USD/IDR pair’s moves as it trades near 14,188 during Friday morning in Asia.
While an area between 14,224 and 14,085, indicating 21-D EMA and aforementioned support-line respectively, continues to challenge momentum traders, 14-day relative strength index (RSI) also portrays the inaction.
If we observe the gradual declines since May-end, its wise to look at the 14,000 and April month low near 13,970 as targets on the break of 14,085.
However, the break of 13,970 might not refrain from pleasing bears with 13,942 and 13,859.
On the contrary, pair’s rise past-14,224 can trigger its recovery to May 30 low near 14,311 whereas 5-week old descending trend-line at 14,334 can question bulls then after.
USD/IDR daily chart
Trend: Sideways