Back
22 Jul 2019
Gold technical analysis: Bounces off 23.6% Fibo. towards $1436.50/37 supply zone
- Short-term ascending trend-lines add support below 23.6% Fibonacci retracement for Gold.
- $1,436.50/37 will validate the strength of the latest pullback.
Gold is again being bought as it reverses from 23.6% Fibonacci retracement of June-July advances to $1,427 by early Monday.
The yellow metal now runs towards $1,436.50/37 horizontal resistance comprising early-month tops, a break of which can propel the quote towards the recent high of $1,452.70. During the bullion’s sustained rise past-$1,452.80, late-April 2013 high close to $1,490 should be on the bulls’ watch-list.
If prices slip back below 23.6% Fibonacci retracement level of 1,421, near-term support-lines around $1,408 and $1,391 could play their roles to limit the declines.
Given the sellers’ dominance beneath $1,391, $1380/78 should be watched closely as it holds the key to $1,350 rest-point.
Gold 4-hour chart
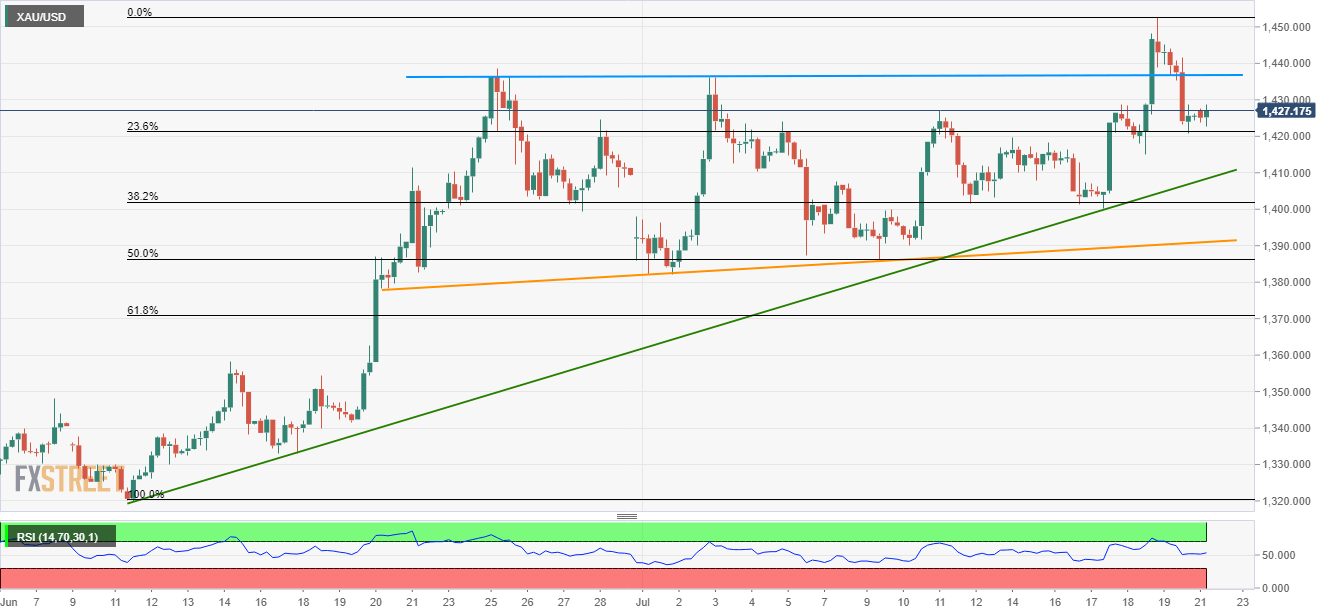
Trend: Bullish