Back
30 Aug 2019
EUR/USD technical analysis: Euro collapses to 2-year lows, sub-1.1000 level
- EUR/USD falls to 2-year lows as the Greenback strengthens across the board.
- The level to beat for bears is the 1.1016 support followed by the 1.1039 level.
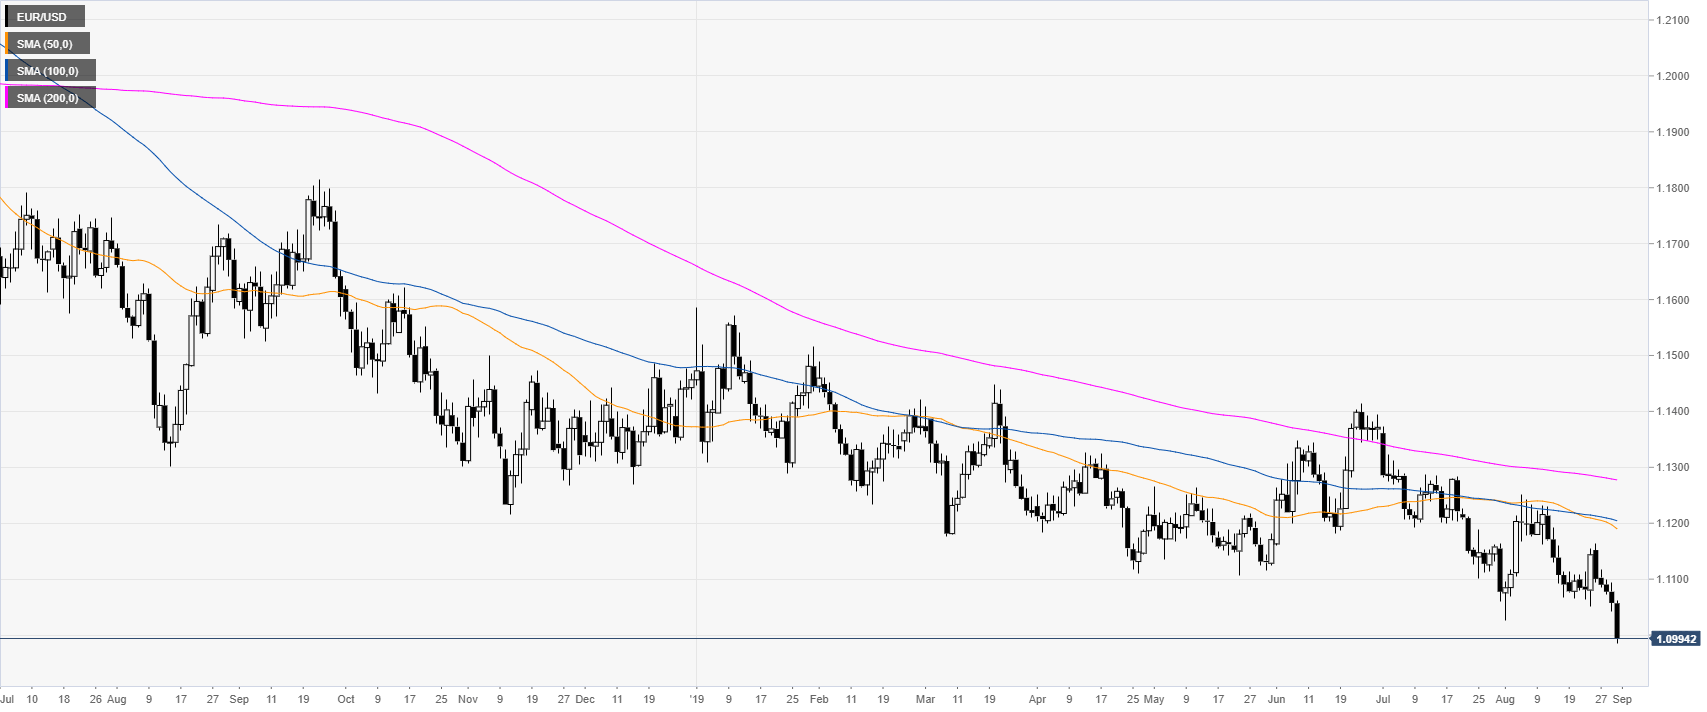
EUR/USD daily chart
On the daily time-frame, the shared currency is trading in a bear trend below the main daily simple moving averages (DSMAs). EUR/USD just broke to its lowest since 2017.
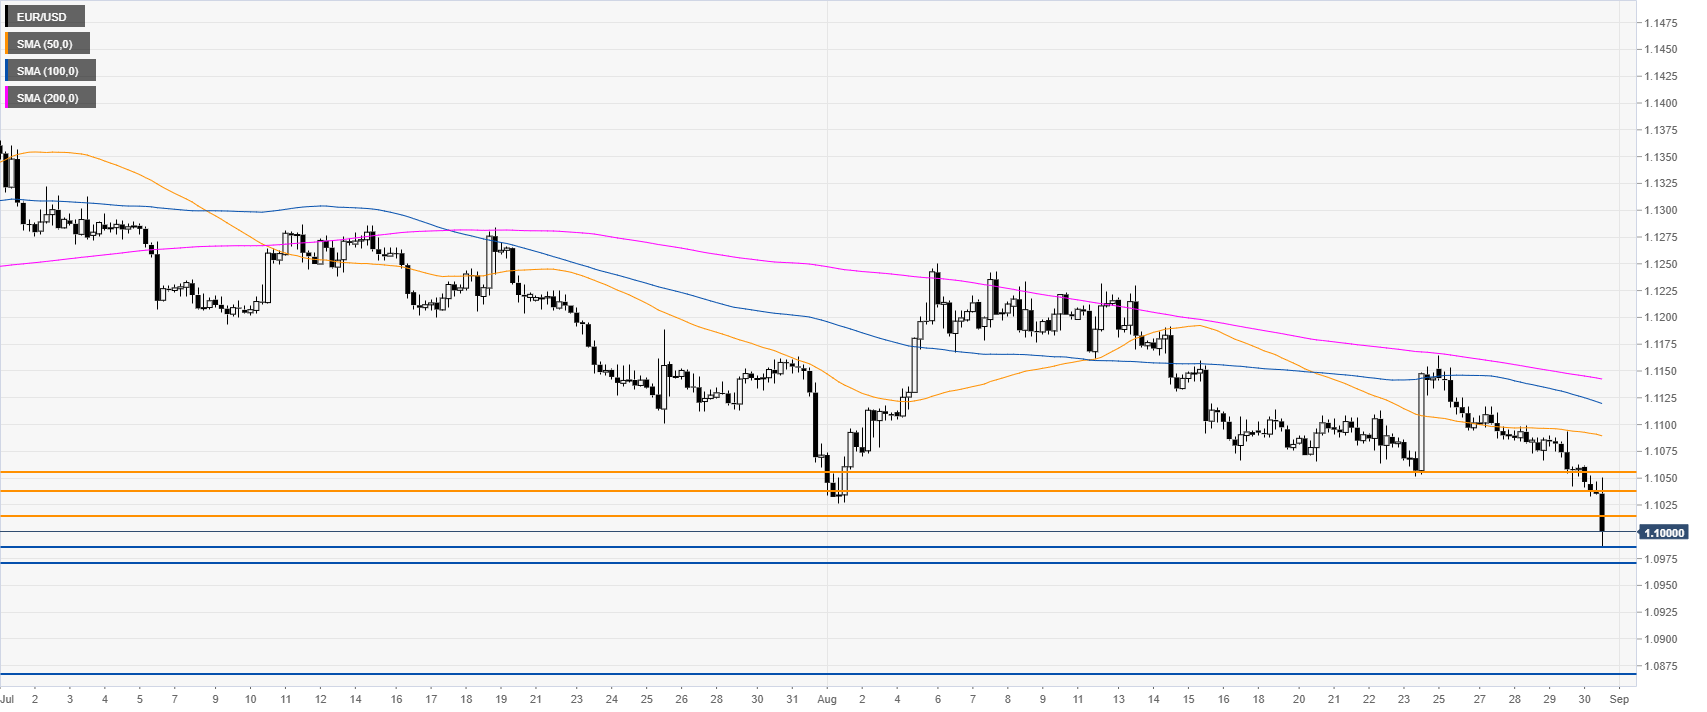
EUR/USD 4-hour chart
The bearish pressure is unabated as the market reached 2-year lows. The market is challenging the 1.1016 support while the next level is 1.1039. If broken, the market could precipitate towards 1.0870, according to the Technical Confluences Indicator.
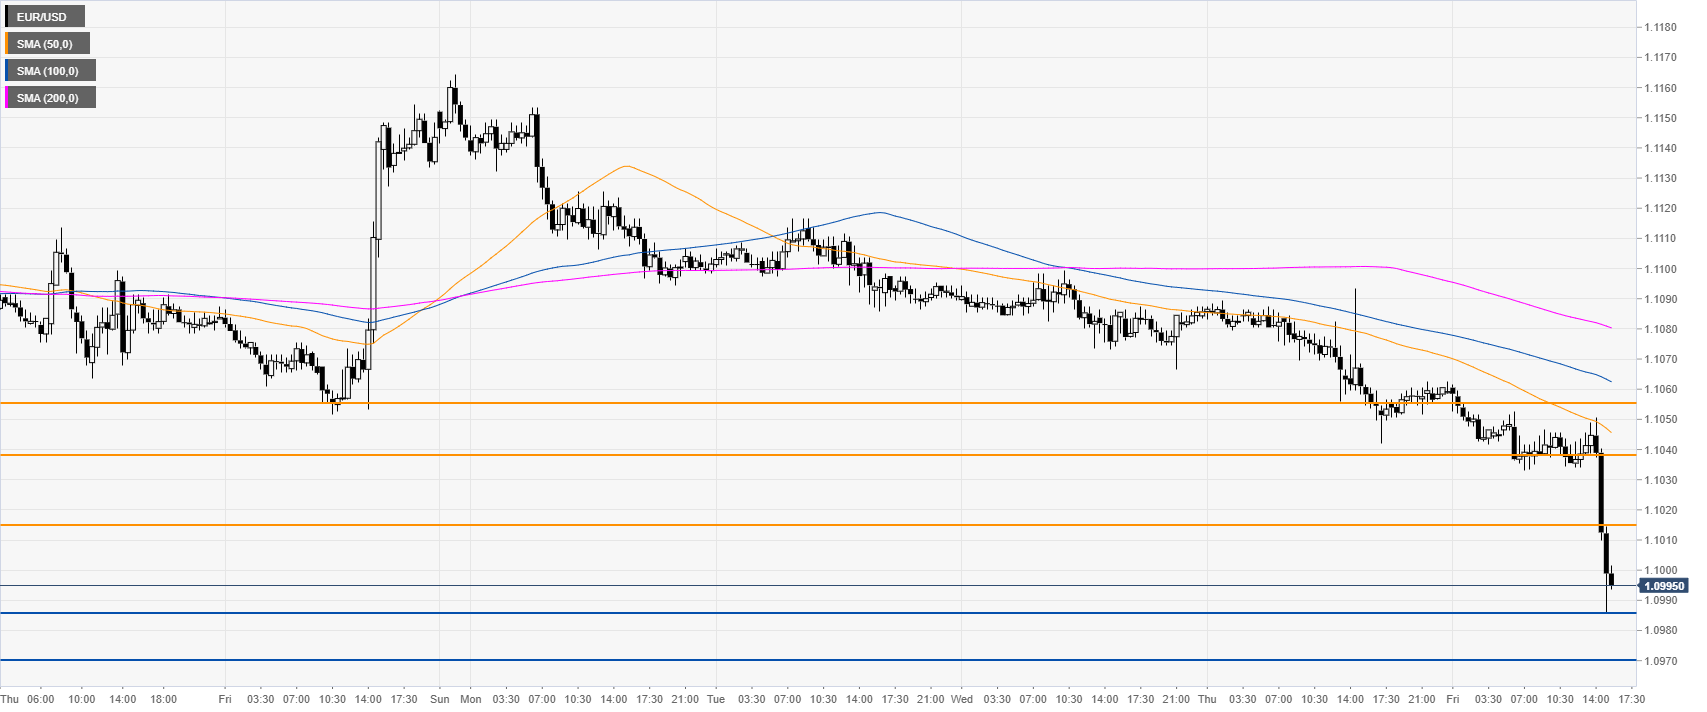
EUR/USD 30-minute chart
EUR/USD is trading below the main SMAs, suggesting a bearish momentum in the near term. Immediate resistances are seen at 1.1016, 1.1039 and 1.1056 levels, according to the Technical Confluences Indicator.
Additional key levels