Back
29 Oct 2019
GBP/USD technical analysis: Cable rolling into the Asian session below the 1.2900 handle
- Brexit optimism sent GBP/USD on a rollercoaster this Tuesday. However, the Currency pair is about to end the day virtually unchanged.
- Breaking: UK election will be 12 Dec (GBP positive).
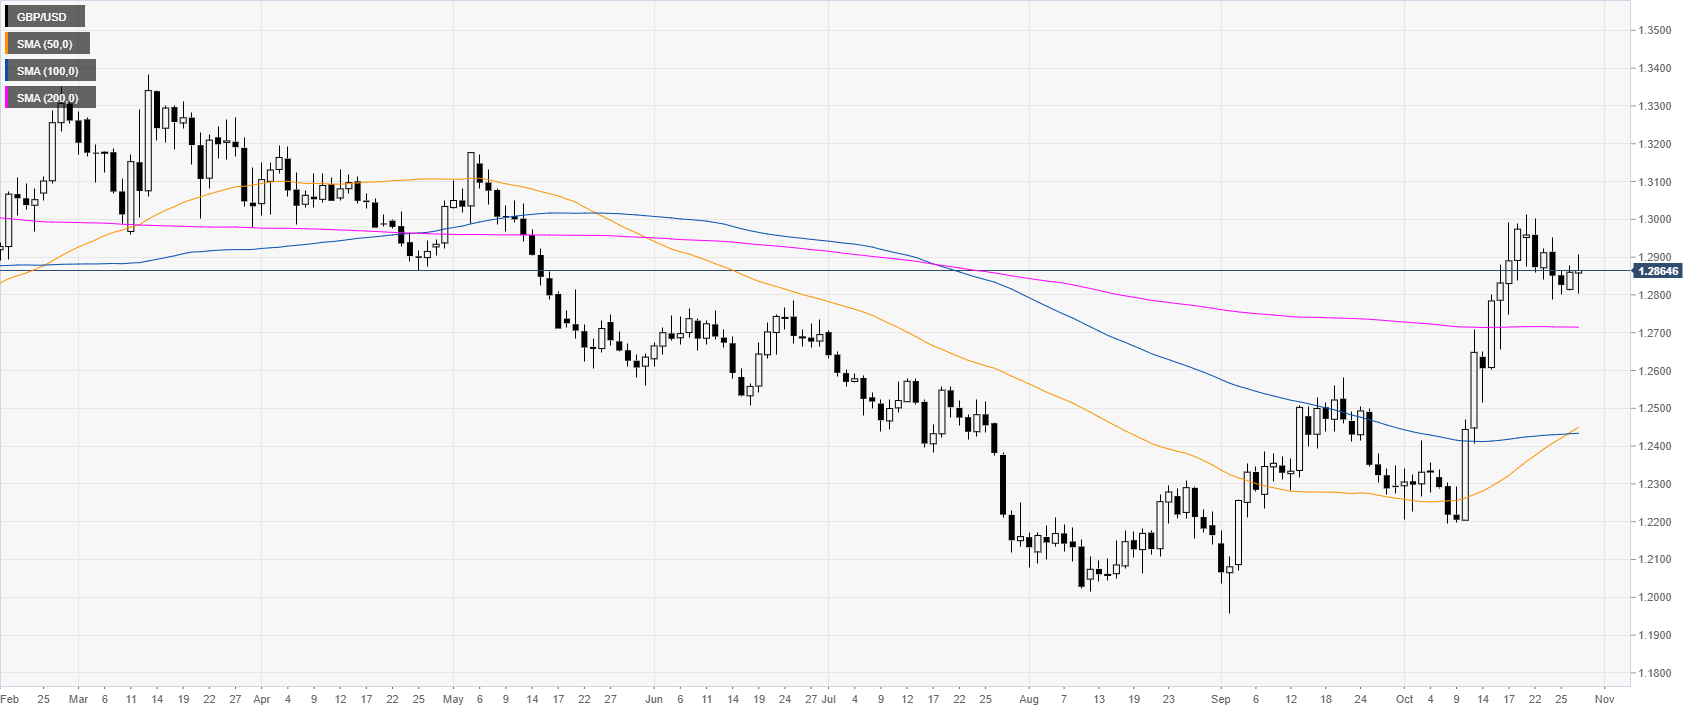
GBP/USD daily chart
In October, the Sterling spiked up above its main daily simple moving averages (DMAs) and reached levels not seen since mid-May 2019. Breaking: UK election will be 12 Dec (GBP positive).
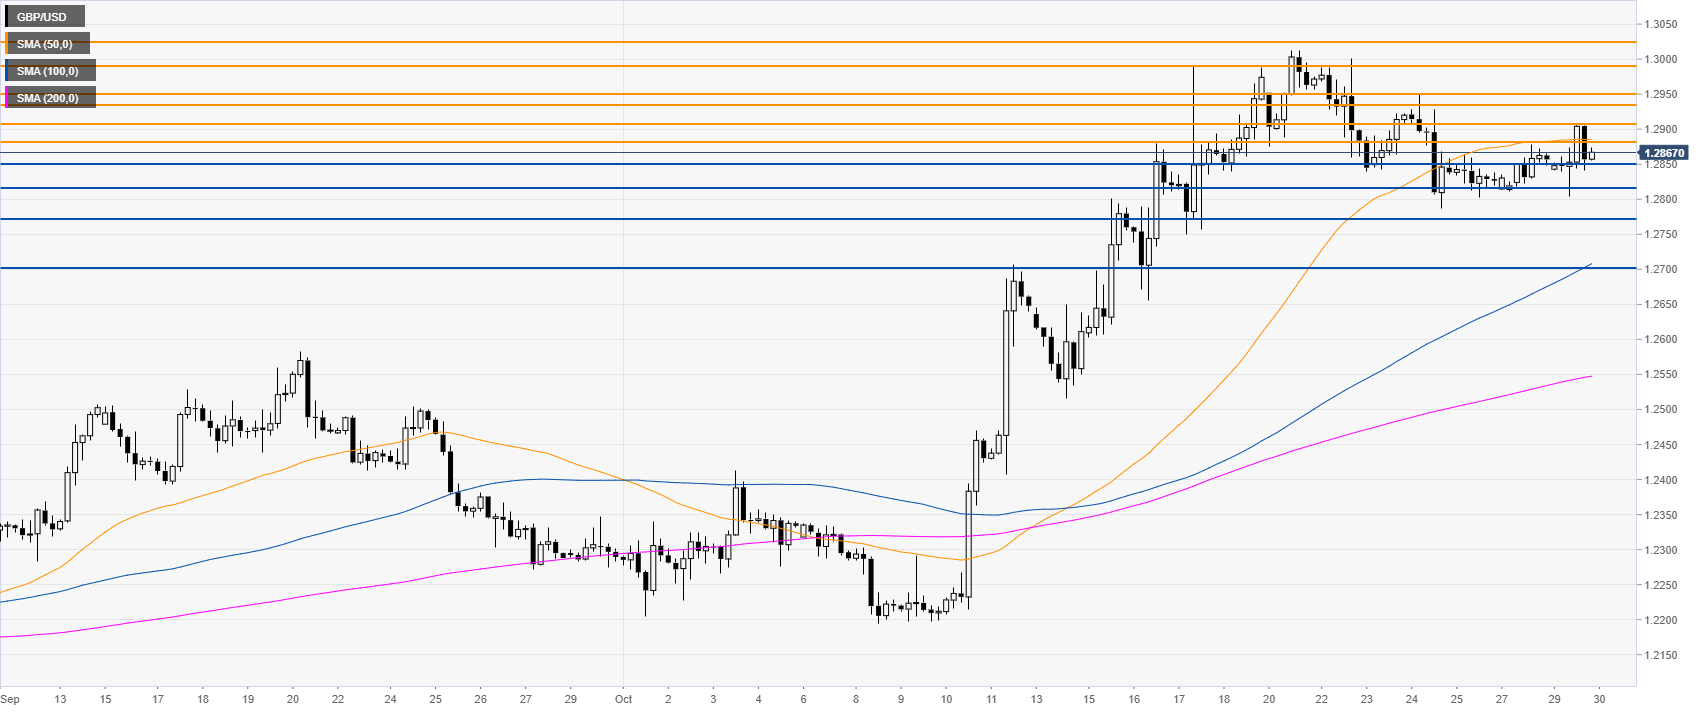
GBP/USD four-hour chart
GBP/USD is ranging below the 1.2900 figure and the 50 SMA. Once again, the spot failed at the 1.2880 resistance near the 50 SMA. The market will need to surpass that level for a retest of the 1.2950/1.3000 resistance zone, according to the Technical Confluences Indicator.
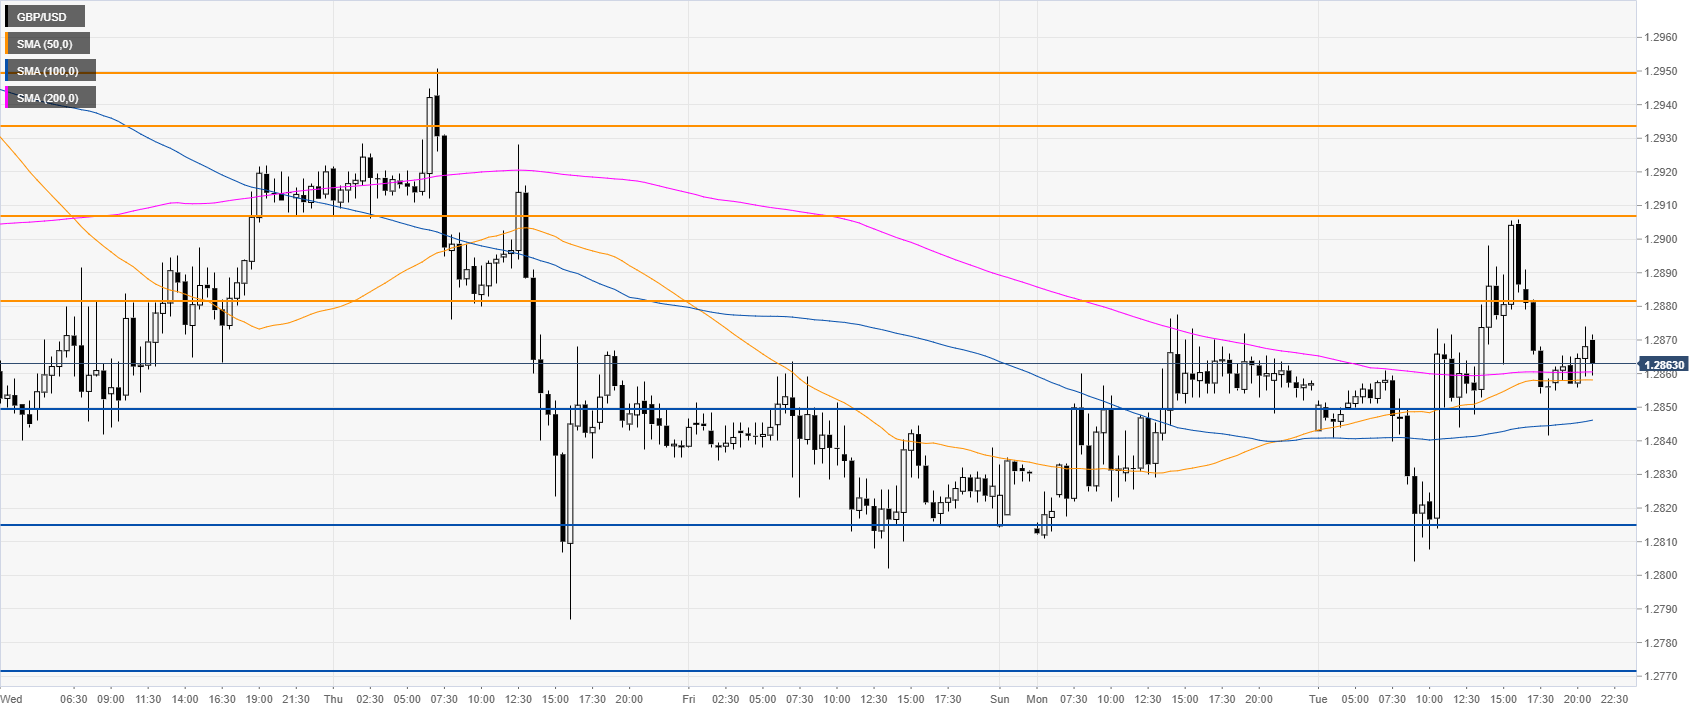
GBP/USD 30-minute chart
GBP/USD is trading above its main SMAs, suggesting bullish momentum in the near term. Support is seen at 1.2850 and 1.2815, according to the Technical Confluences Indicator.
Additional key levels