EUR/USD sale seems more appealing on Black Friday – Confluence Detector
EUR/USD has been maintaining its range trading around 1.10 as global shoppers grab discounts on Black Friday. How is the currency pair positioned on the chart?
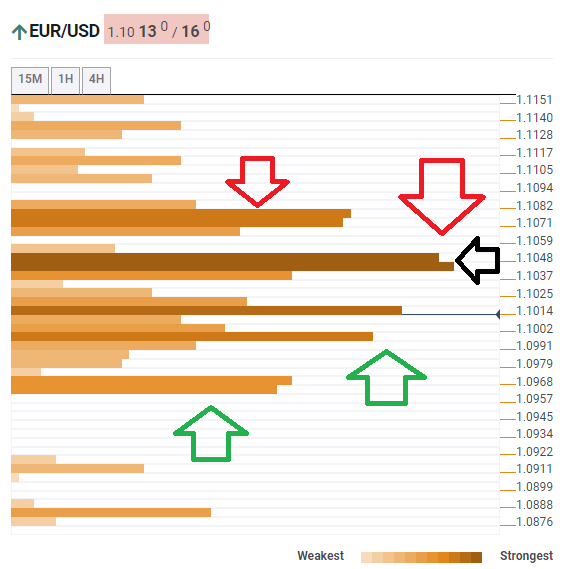
The Technical Confluences Indicator is showing that EUR/USD is struggling around 1.1014, which is a dense cluster including the Simple Moving Average 504h, the Bollinger Band 15min-Lower, the BB 1h-Middle, the SMA 5-15m, the SMA 10-15m, the Fibonacci 38.2% one-day, and the SMA 5-1d.
Fierce resistance awaits at 1.1042, which is the convergence of the SMA 200-1h, the SMA 50-4h, the SMA 50-1d, the Pivot Point one-day Resistance 3, and the all-important Fibonacci 38.2% one-week.
Further above, euro/dollar faces a confluence of lines at 1.1076, where we find the Fibonacci 61.8% one-week and the PP one-week R1.
Support awaits at 1.0995, which is a juncture including the PP one-week S1 and the Fibonacci 61.8% one-month.
Further down, support awaits at 1.0968, where we see the BB 1d-Lower and the PP one-month converge.
Here is how it looks on the tool:
Confluence Detector
The Confluence Detector finds exciting opportunities using Technical Confluences. The TC is a tool to locate and point out those price levels where there is a congestion of indicators, moving averages, Fibonacci levels, Pivot Points, etc. Knowing where these congestion points are located is very useful for the trader, and can be used as a basis for different strategies.
This tool assigns a certain amount of “weight” to each indicator, and this “weight” can influence adjacents price levels. These weightings mean that one price level without any indicator or moving average but under the influence of two “strongly weighted” levels accumulate more resistance than their neighbors. In these cases, the tool signals resistance in apparently empty areas.
Learn more about Technical Confluence