Back
6 May 2020
USD/MXN Price Analysis: Mexican peso grinds down between key levels
- USD/MXN awaits firm direction after two-day declines.
- Sustained trading below 21-day SMA, bearish MACD keep sellers hopeful.
- Six-week-old rising trend line challenges the bears.
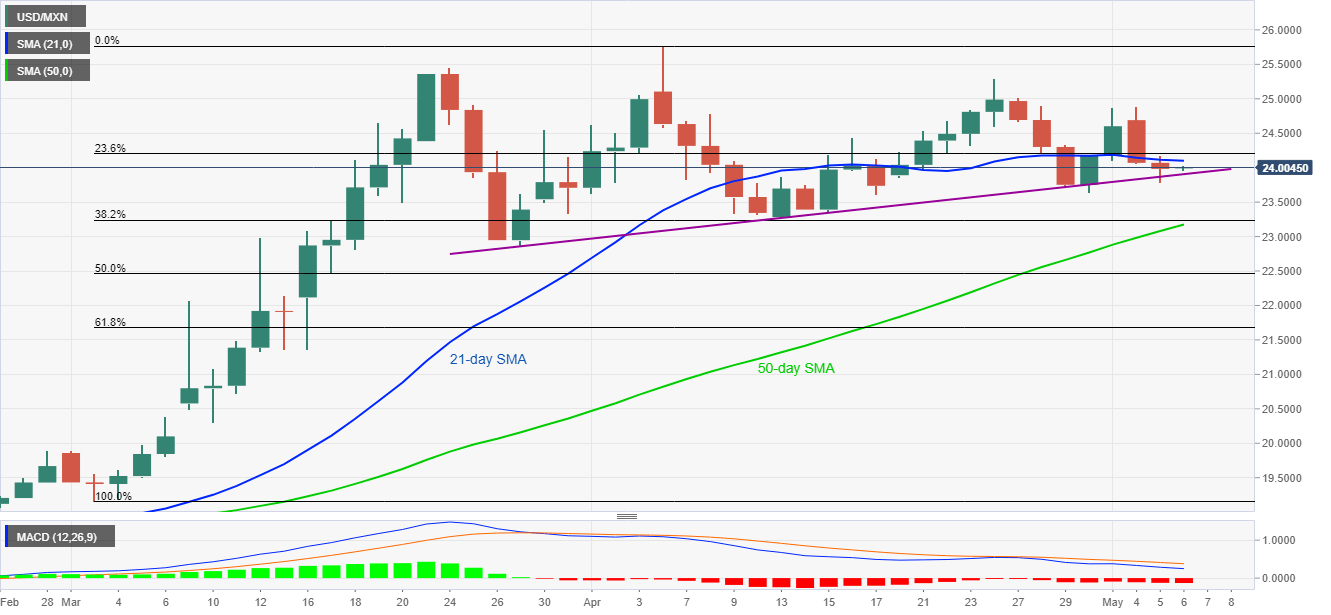
USD/MXN registers mild losses of around 0.06% while taking rounds to 24.00 during the Asian session on Wednesday.
Even so, bearish MACD and sustained trading below 21-day SMA keeps the sellers titled down towards a short-term rising trend line, currently around 23.90.
If the pair manages to post a daily closing below 23.90, the bears will be able to meet a 50-day SMA level of 23.17 during further declines. Though, April month low near 23.30 can offer an intermediate halt during the fall.
Meanwhile, an upside clearance of 21-day SMA, at 24.10 now, can trigger the pair’s run-up to the monthly top near 24.90 ahead of targeting April 24 high near 25.30.
USD/MXN daily chart
Trend: Sideways