USD/CHF Price Analysis: Below 200-HMA, inside short-term falling channel
- USD/CHF seesaws in the middle of the weekly descending trend channel.
- A gradually diminishing strength suggests the return of the early-month low.
- An upside break of the channel will have multiple resistances before luring the bulls.
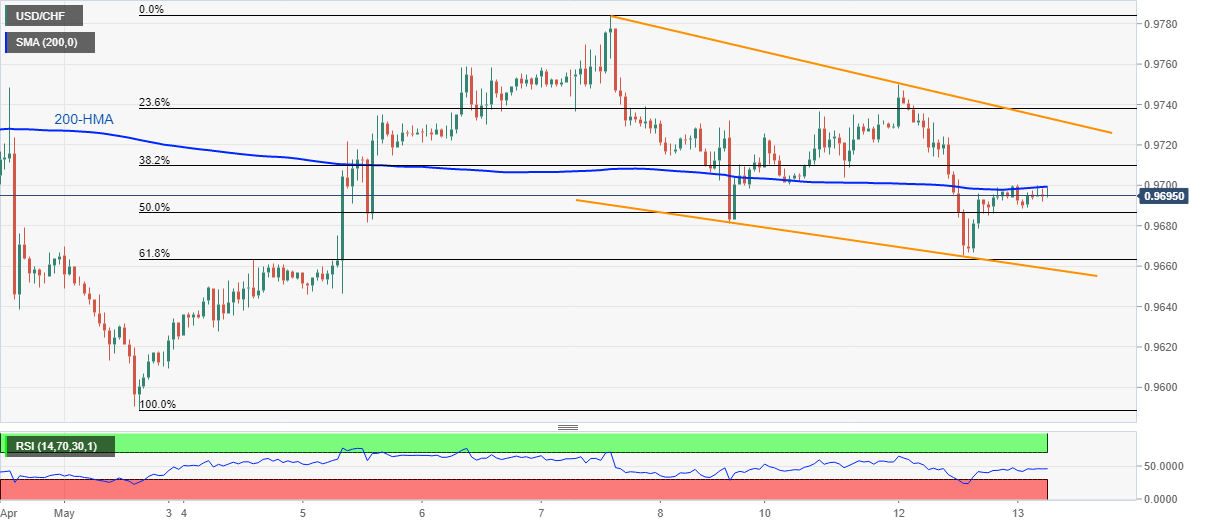
USD/CHF clings to sub-0.9700, currently near 0.9695, during the initial trading on Wednesday.
Despite bouncing off 50% Fibonacci retracement of the early-month rise, the quote repeatedly fails to cross 200-HMA. Also portraying the momentum weakness is the one-week-old falling trend channel.
Hence, sellers are on the lookout for a 61.8% Fibonacci retracement level of 0.9665 on the break below 50% Fibonacci retracement, at 0.9685.
Though, the support line of the aforementioned channel, currently near 0.9658, will restrict the pair’s further downside, if not then the monthly low close to 0.9590 will lure the bears.
Alternatively, the channel’s resistance line of 0.9735 can question the pair’s recovery moves past-200-HMA level of 0.9700.
In a case where the quote rises above 0.9735, the monthly high near 0.9785 and the previous month top close to 0.9800 could entertain the buyers.
USD/CHF hourly chart
Trend: Sideways