WTI Price Analysis: Bulls attack $43.00 inside short-term rising channel
- WTI defies the previous day’s pullback from $43.12 with a bounce off $42.76.
- Bullish MACD joins the price-positive chart pattern and suggests further upside.
- Sellers will look for entries below 200-HMA, monthly top lures the buyers.
WTI picks up bids near $42.86, up 0.16% on a day, during the pre-Tokyo Asian session on Thursday. The energy benchmark flaunted the biggest gains in a month on Wednesday while keeping a one-week-old ascending trend channel formation.
Although MACD signals increase the strength of the bullish chart pattern, the channel’s resistance line, at $43.25 now, can question the black gold’s immediate upside.
If at all the buyers manage to cross $43.25, the monthly high near $43.65 and February month’s low near $44.00 will act as additional resistances for them to confront.
Alternatively, $42.30 and the channel’s support line near $41.90 precede a 200-HMA level of $41.81 to challenge the commodity bears.
While August 03 high near $41.40 adds to the supports below the key HMA, the quote’s further downside will make it vulnerable to attack the $40.00 threshold.
WTI hourly chart
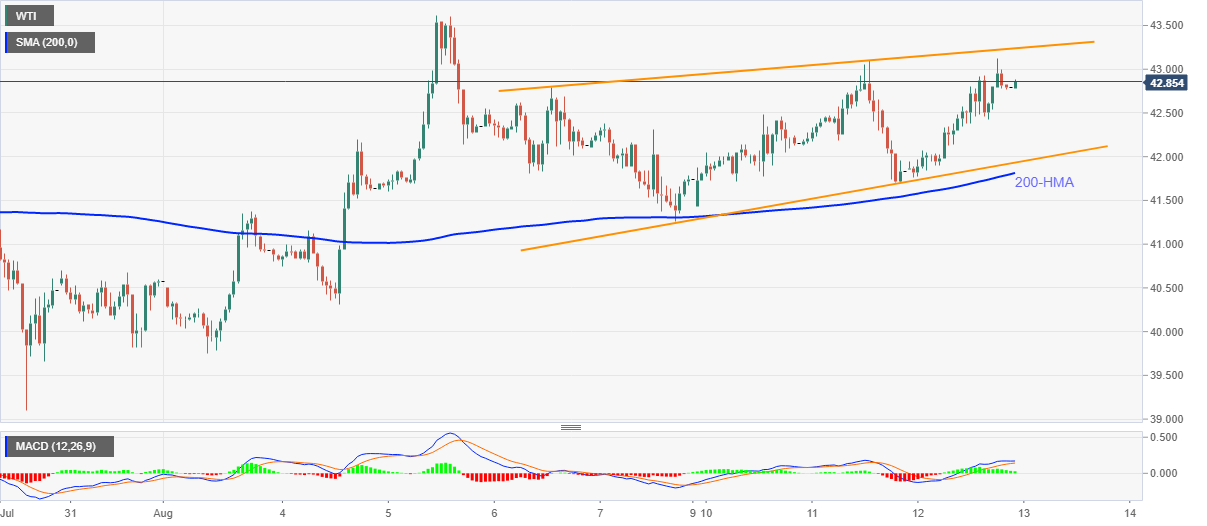
Trend: Bullish