NZD/USD Price Analysis: Bulls rejected by 200-day EMA
- NZD/USD snaps two-day uptrend, takes offers around intraday low of late.
- Failures to cross the key moving average direct the bears to two-month-old horizontal support.
- Downbeat momentum will test sellers below the yellow bottom.
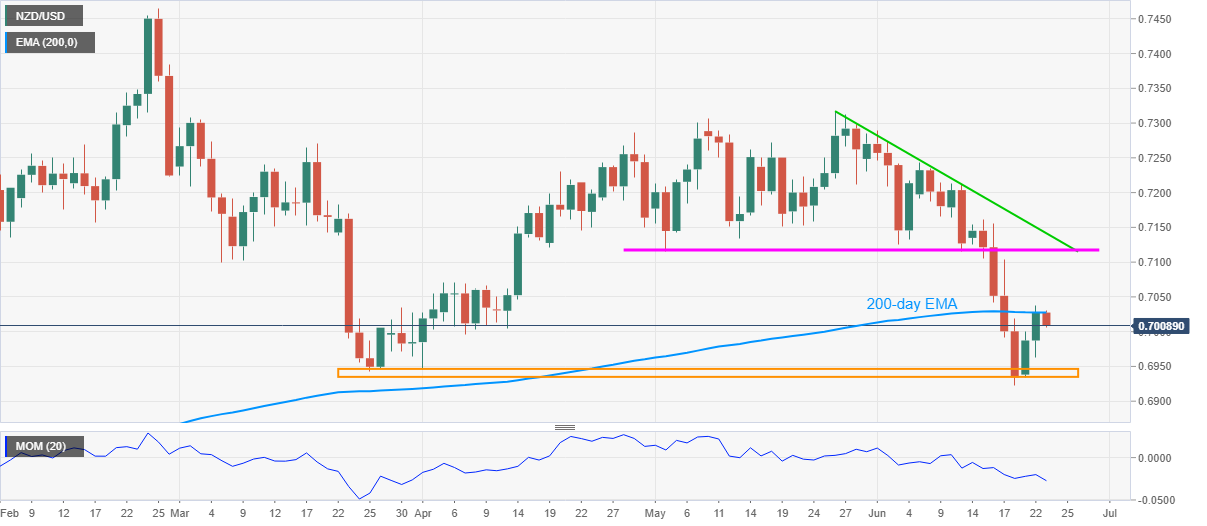
NZD/USD remains pressured near intraday low surrounding the 0.7000 threshold, down 0.26% on a day, amid early Wednesday. In doing so, the kiwi pair prints daily losses for the first time since Friday while taking a U-turn from the 200-day Exponential Moving Average (EMA).
The pair’s failure to cross the key EMA joins the descending Momentum line to suggest the quote’s further weakness.
However, a horizontal area comprising the yearly bottoms between 0.6945 and 0.6935 becomes crucial support to watch during the pair’s further declines.
If at all the NZD/USD bears dominate past 0.6935, the 0.6900 round figure may offer an intermediate halt before dragging the quote to September 2020 tops near 0.6800.
On the contrary, a clear upside break of 200-day EMA, around 0.7030, will aim for a downward sloping trend line from May 26, close to 0.7140.
Though the early April highs and a seven-week-old horizontal line, respectively around 0.7070 and 0.7120, could entertain the NZD/USD buyers during recovery moves above 200-day EMA.
NZD/USD daily chart
Trend: Further weakness expected