Nasdaq (NDX QQQ) Still trending higher with no signs of panic but RSI needs attention
- Nasdaq ends the week in a calm orderly fashion, no need for life jackets.
- Markets remain bullish and have put inflation fears to one side.
- Seasonality put on its head with June almost over.
Equity markets continue to remain strongly bullish with the TINA trade (there is no alternative) and buy the dip continuing to reap strong profits for traders and investors as a rising tide is lifting all boats (stocks). Friday saw modest losses across some Nasdaq names with the tech index closing just in the red down 0.14% while the S&P 500 hit yet another record high close.
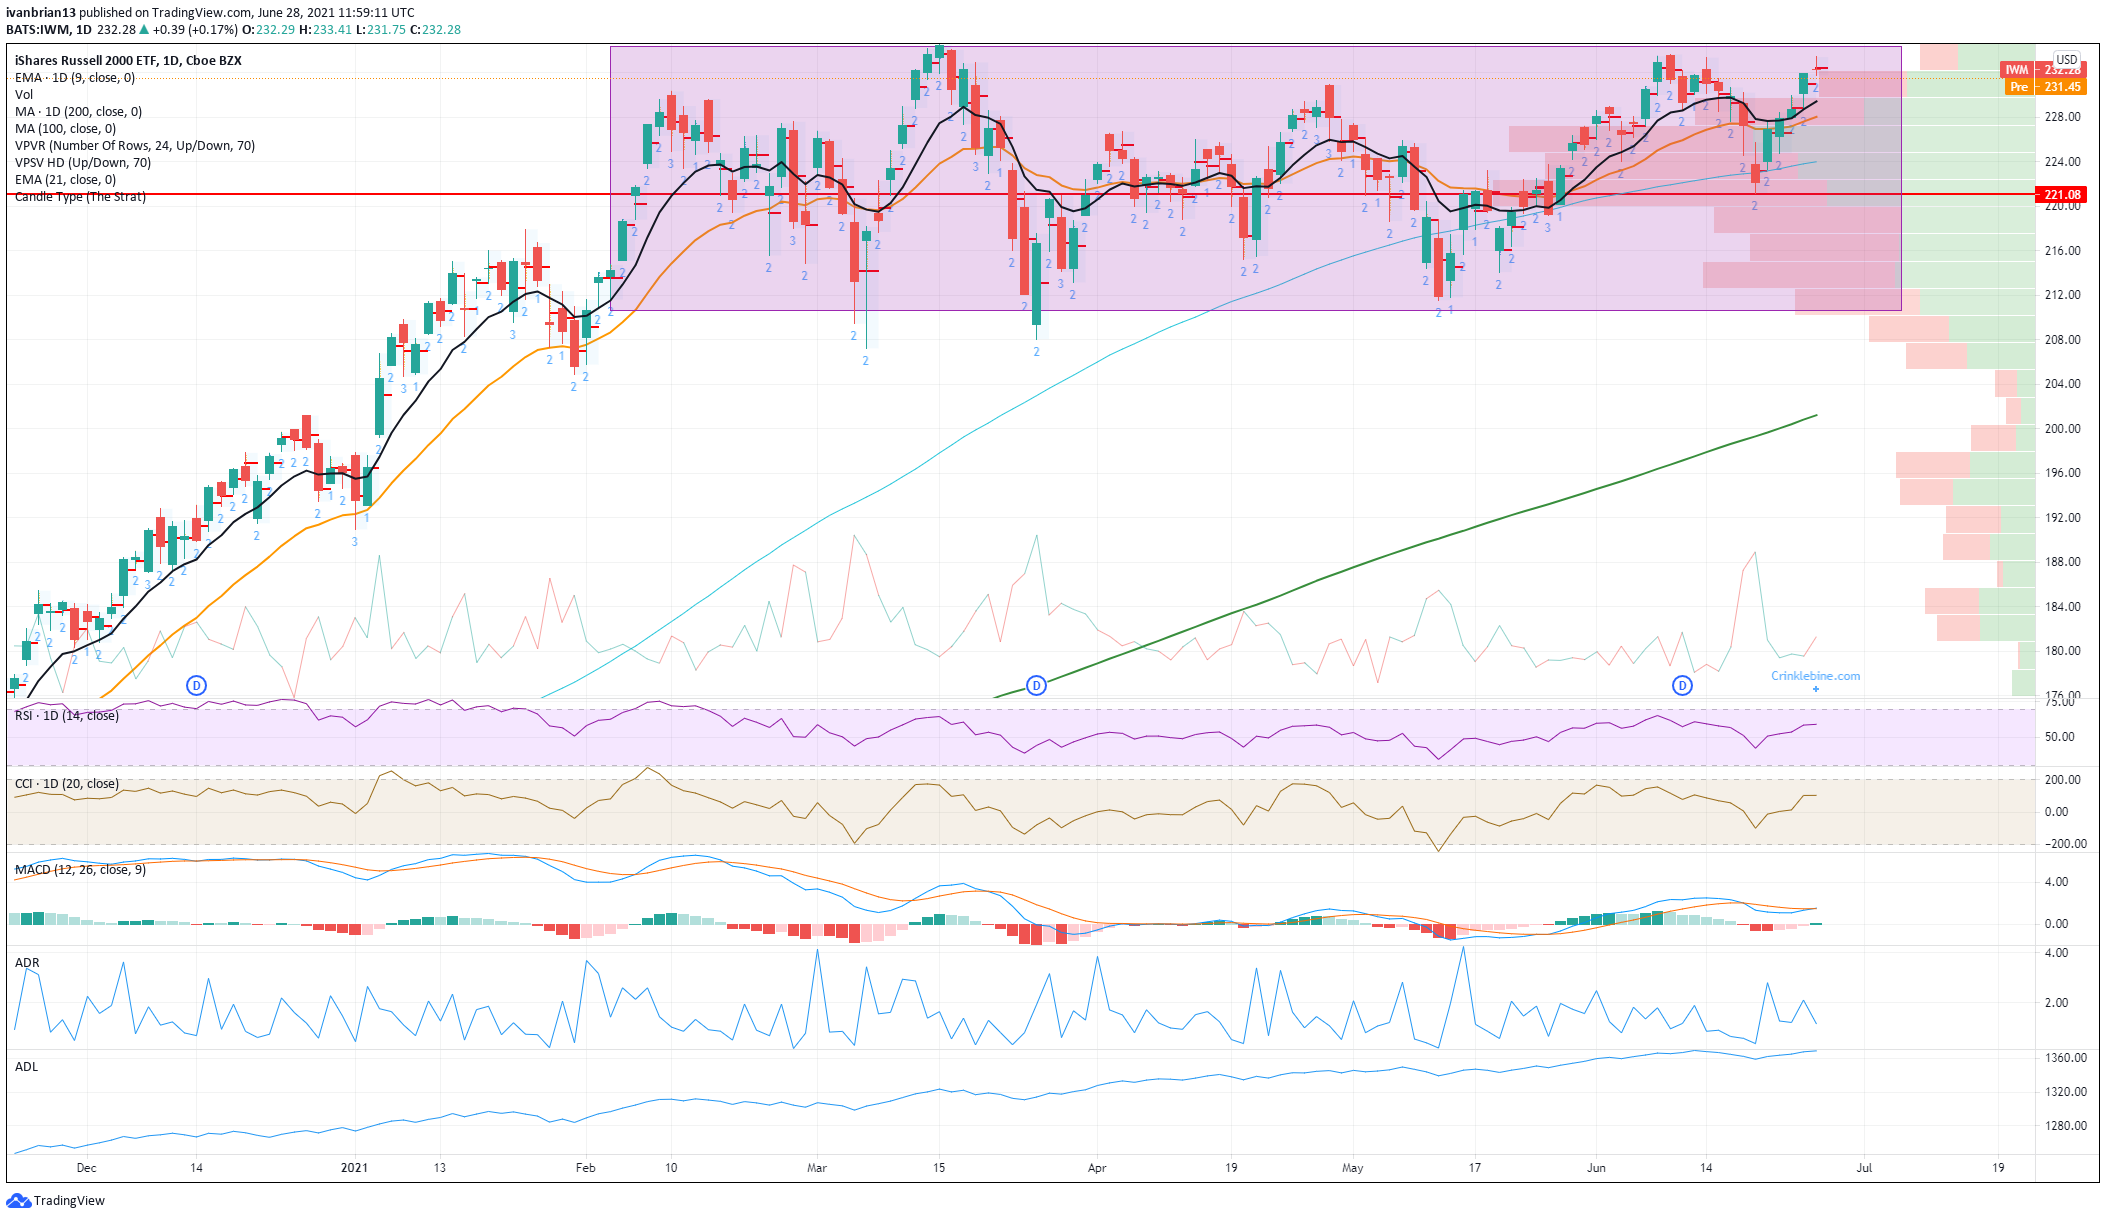
The canary in the coalmine we identified last week is still alive and chirping (Russell 2000) but it still needs to take out this larger range play it has been stuck in, to free up further gains for all indices. It is moving in the right direction though. Range breakouts, as we said last week, can be powerful but so can double or this would be a triple top. So watch this space closely. Given the trend in equity markets and how well they have reacted to the Fed's increasingly hawkish (higher rates) talk one would have to bet on the break-out scenario for the Russell. The Moving Average Convergence Divergence (MACD) also seems to be following this logic and about to give a bullish crossover.
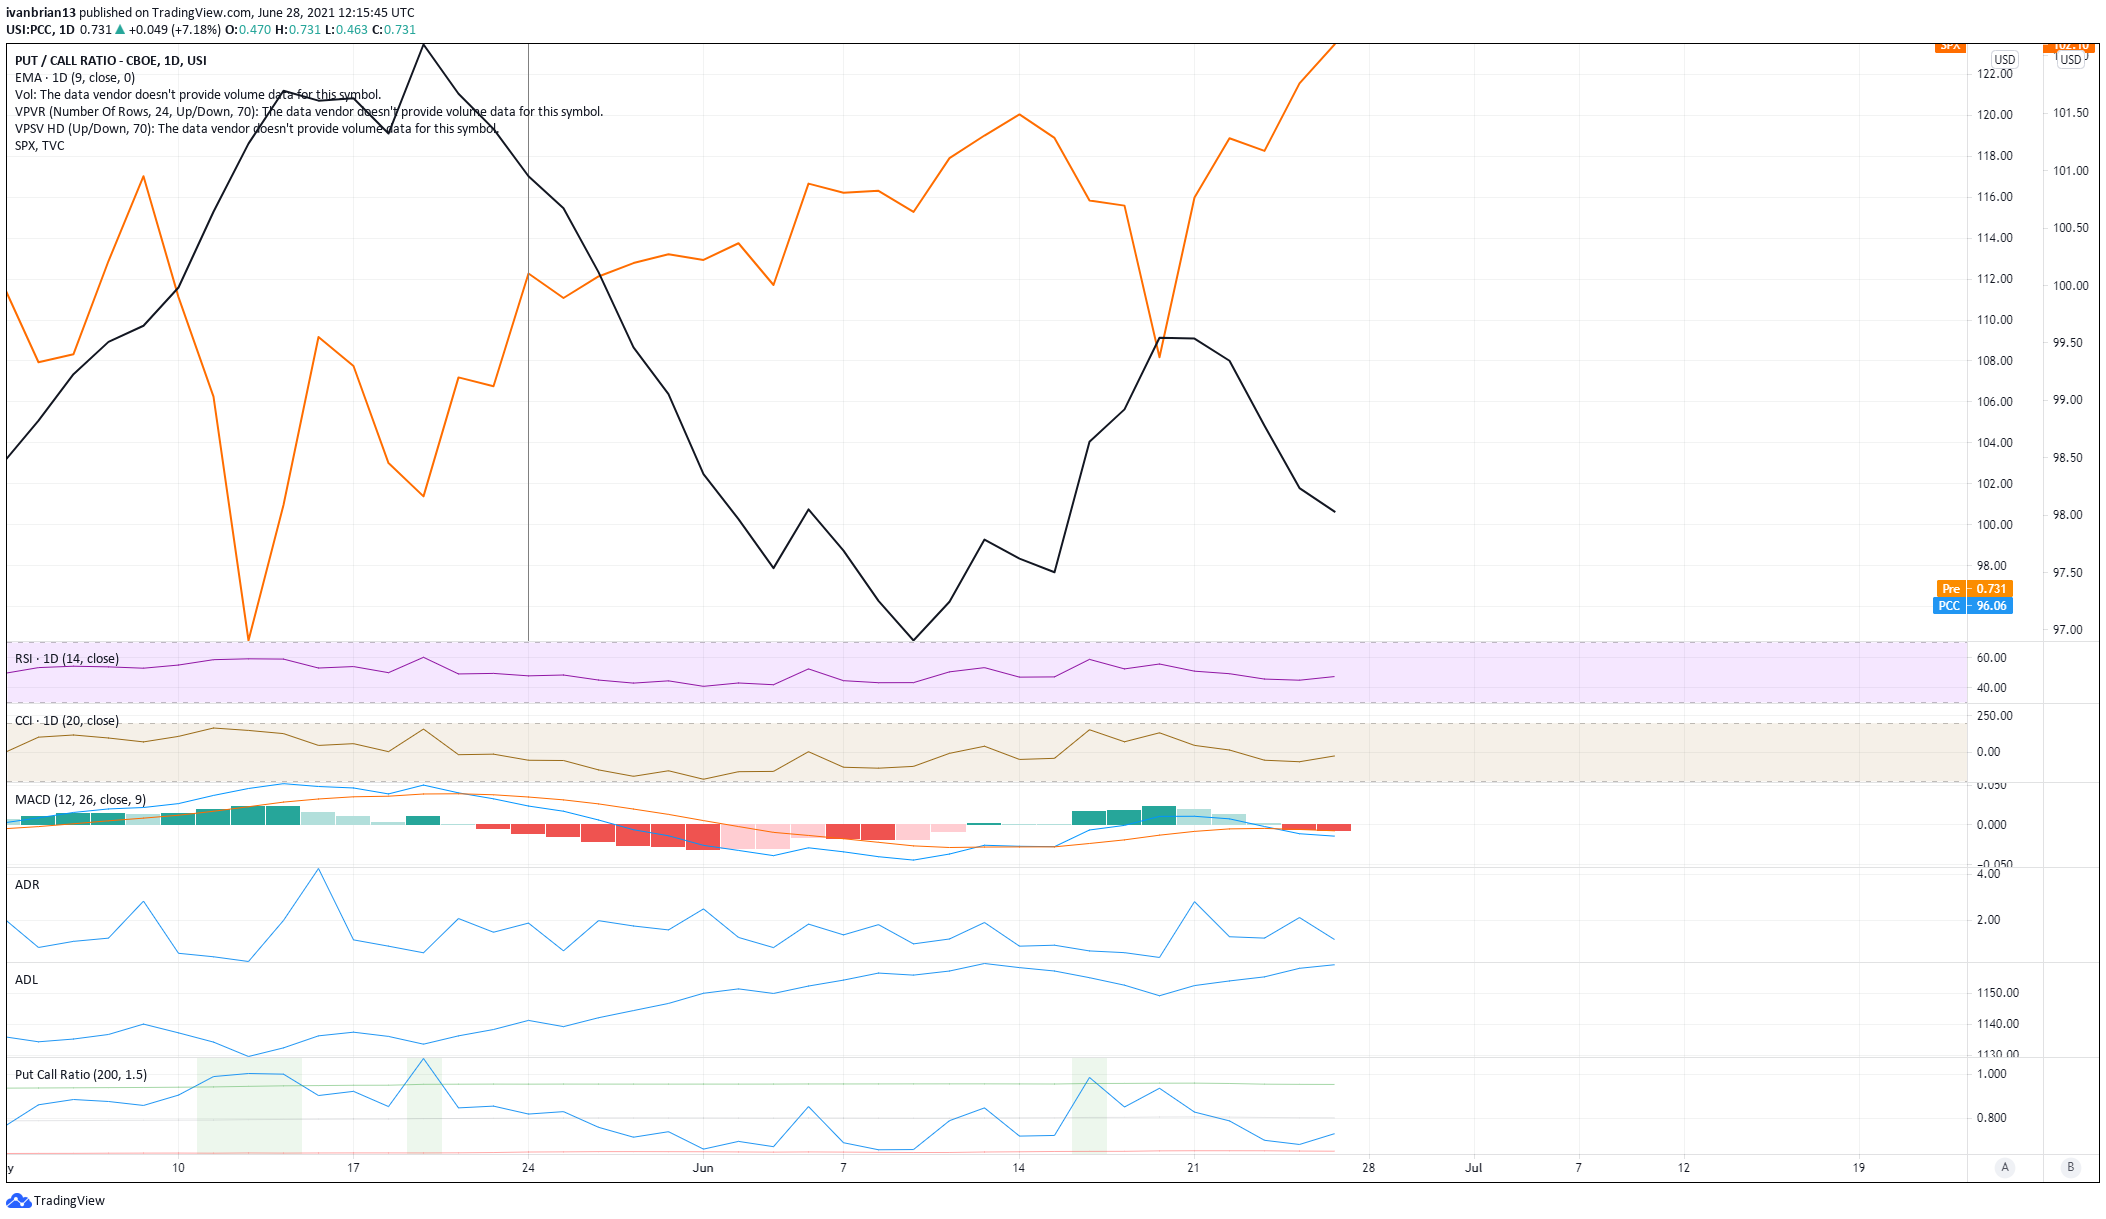
The put-call ratio is far from a perfect indicator but does give a guide to investor sentiment. The ratio itself can skew around especially when we have had quadruple witching and Russell rebalancing on consecutive Fridays but the 9- day moving average shows the put-call ratio steadily declining as investors turn against purchasing puts be it for speculative or hedging purposes. There is a general inverse correlation with the equity market. The put-call ratio rises when investors buy more puts as they are more bearish so markets could or should also be bearish. May saw a steady decline in the ratio as it seems everyone grew tired of waiting for the dip!
Nasdaq (QQQ NQ) forecast
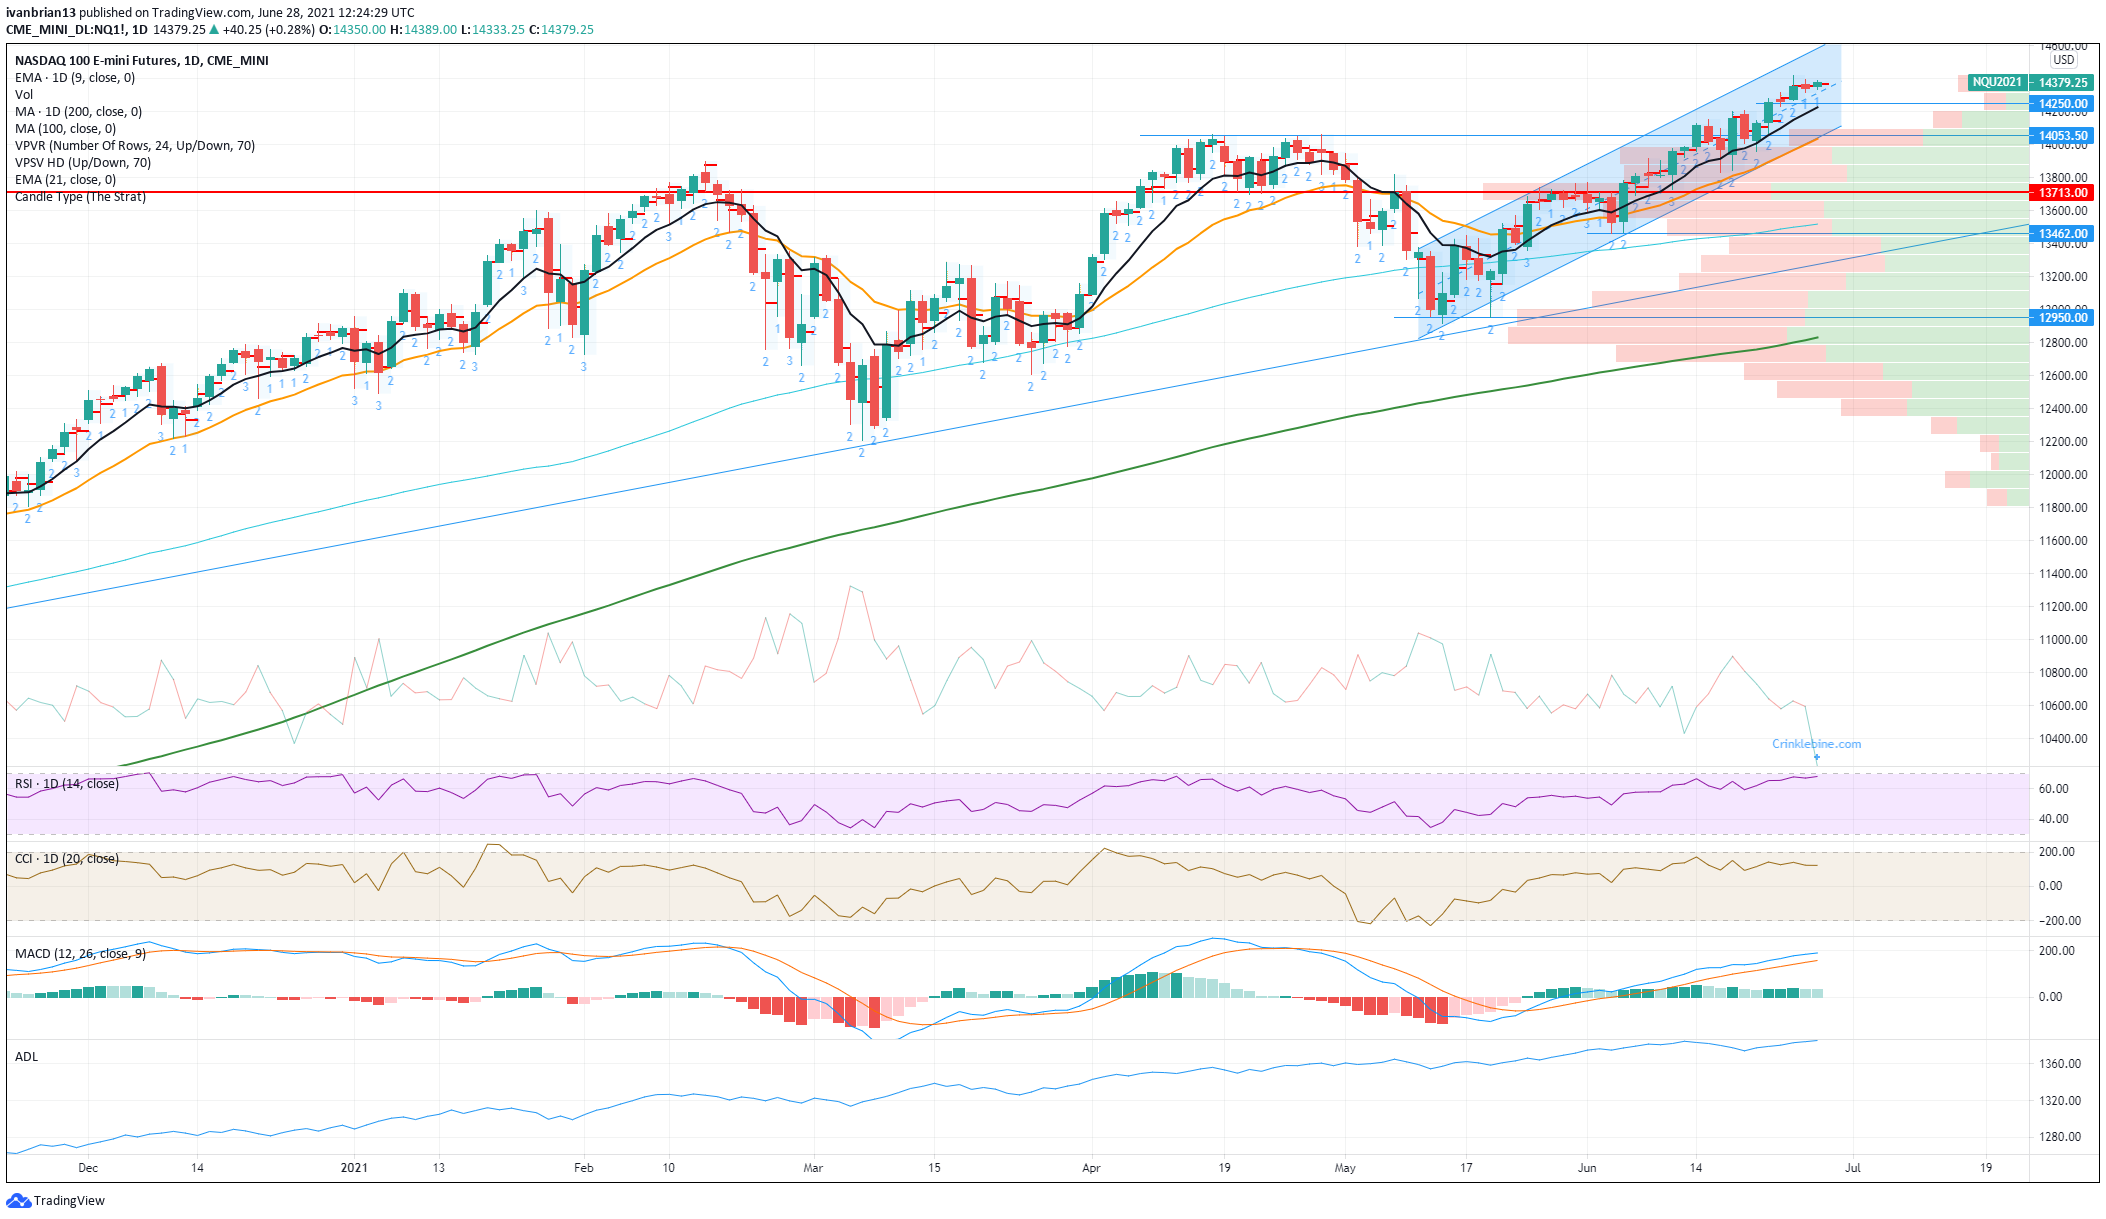
Onwards and upwards is the way forward with Friday seeing a modestly lower close but nothing to break the bullish trend. Advance/Decline line still following the market higher. This is a market breath indicator showing the number of stocks advancing minus the number of stocks declining. The up move has slowed but is still held in place by the 9-day moving average support, currently at 14,226. This is close to our key short-term support at 14,250. Friday gave us an inside candle which is an indecision candle. This candle is a consolidation candle in a breakout but in a strong trend is a bit more neutral. So for Monday, we need to see a bit more work done and not have another inside candle, please.
Support at 14,250 and then 14,050 the April and May series of highs which acted as a buy the dip double top. Medium-term support is at 13,462 with 12,950 the double bottom from mid-May that set up this record push and strong trend channel.
The Relative Strength Index (RSI) is a bit toppy and close to overbought so keep an eye on this. It may signal another dip and buying opportunity. That appears to be the strategy for 2021 so far, if it ain't broke don't fix it.
Like this article? Help us with some feedback by answering this survey: