USD/CAD Price Analysis: Inverse Head & Shoulders keep buyers hopeful around 1.2750
- USD/CAD grinds higher around one-week top, defends Friday’s stellar run-up.
- Bullish chart pattern joins firmer MACD, sustained trading beyond 200-SMA to favor buyers.
- Monthly horizontal support restricts short-term downside, bulls need validation from 1.2800.
USD/CAD seesaws around 1.2750 during Monday’s Asian session, having jumped the most in a week the previous day.
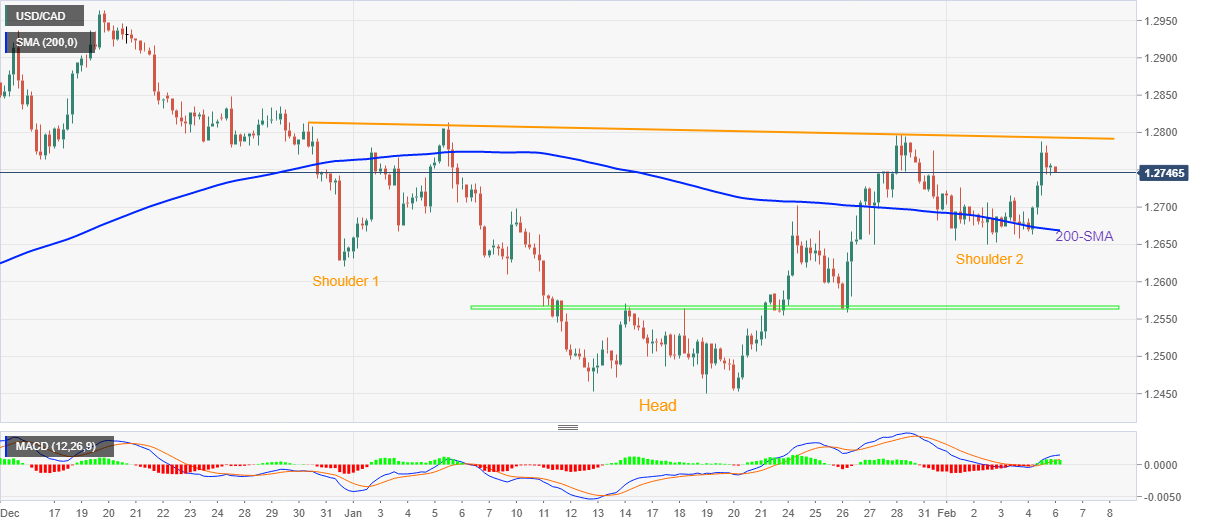
In doing so, the Loonie pair stays near the breakout point, namely the neckline, of a bullish chart pattern called “Inverse Head & Shoulders”.
Also keeping buyers hopeful are the Bullish MACD signals and the successful trading above 200-SMA.
However, a clear upside break of the 1.2800 level becomes necessary to confirm the bullish formation, which in turn will hint at the theoretical rally towards 1.3150.
During the rise, January’s top near 1.2815 and the 1.3000 round figure may act as intermediate halts.
On the contrary, pullback moves remain elusive beyond the 200-SMA level of 1.2670, a break of which will direct USD/CAD bears towards a horizontal area comprising multiple levels marked since January 11, near 1.2560.
USD/CAD: Four-hour chart
Trend: Further upside expected