NZD/USD Price Analysis: Previous support tests recovery moves around 0.6550
- NZD/USD dribbles around intraday high after rising the most since November 2018.
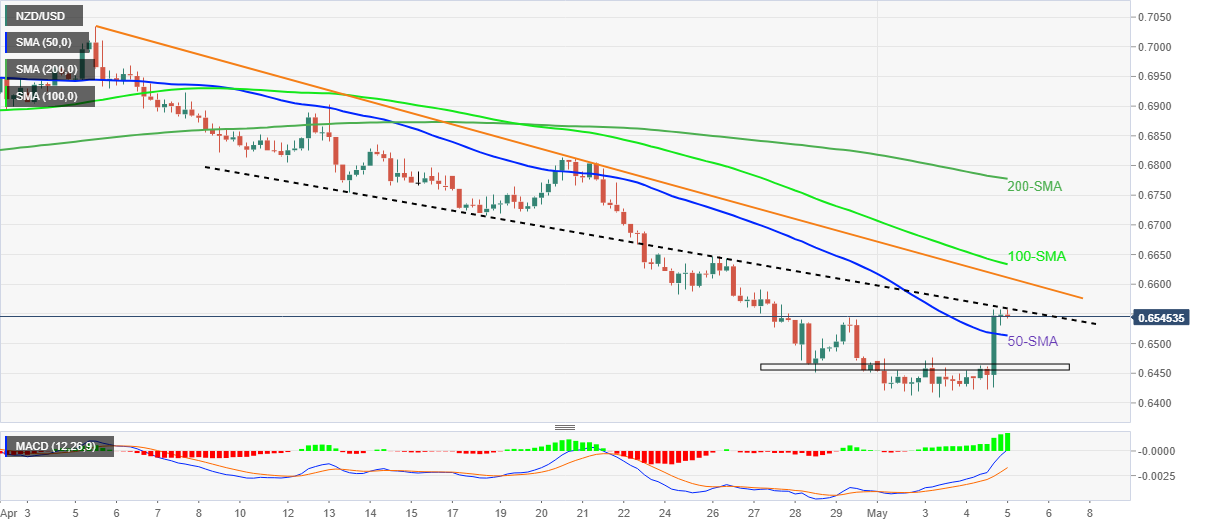
- Descending trend line from April acts as an immediate support-turned-resistance.
- Bullish MACD signals and sustained trading beyond 50-SMA keep buyers hopeful.
NZD/USD bulls jostle with a short-term key hurdle surrounding 0.6550 amid Thursday’s Asian session, following the biggest daily jump in over three years.
However, bullish MACD signals and the Kiwi pair’s ability to stay beyond the 50-SMA hint at the further advances, by crossing the immediate resistance line surrounding 0.6560.
That said, a downward sloping trend line from early April, around 0.6615 by the press time, will challenge the NZD/USD pair’s run-up beyond 0.6560.
Following that, the 100-SMA and the 200-SMA, respectively around 0.6635 and 0.6780, could act as the last defenses for the buyers.
On the contrary, a downside break of the 50-SMA, around 0.6510, will recall the NZD/USD sellers.
In that case, the 0.6465-55 horizontal area will probe the bears before directing them to the monthly low, also the lowest since mid-2020, around 0.6410.
NZD/USD: Four-hour chart
Trend: Further upside expected